Published
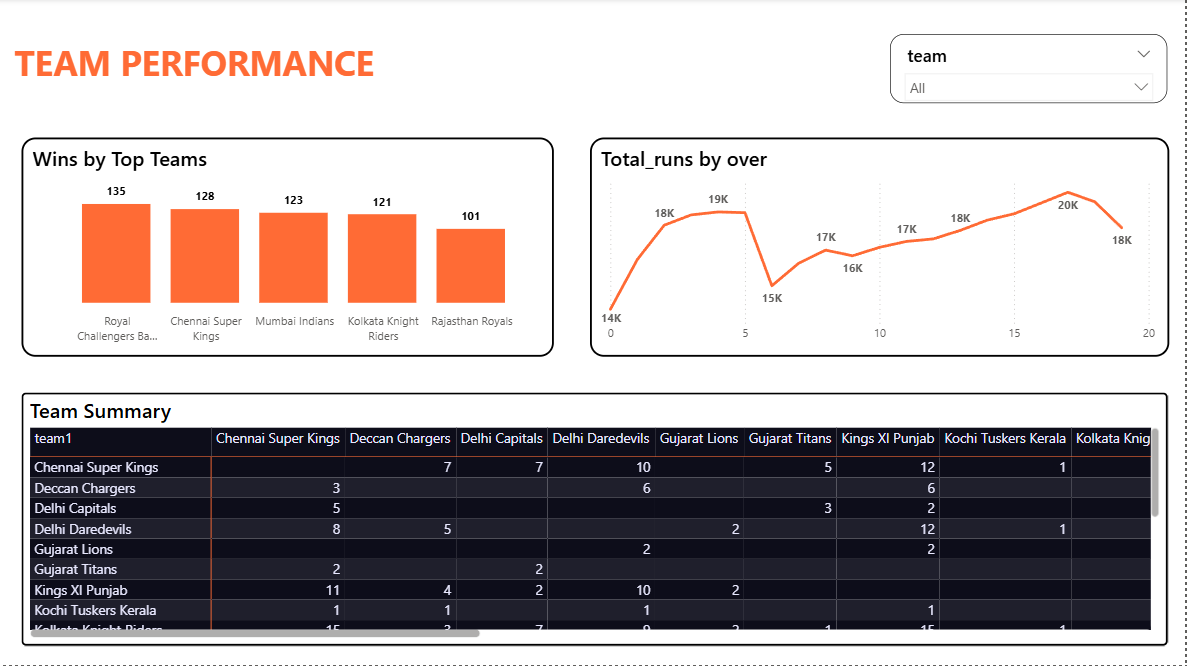
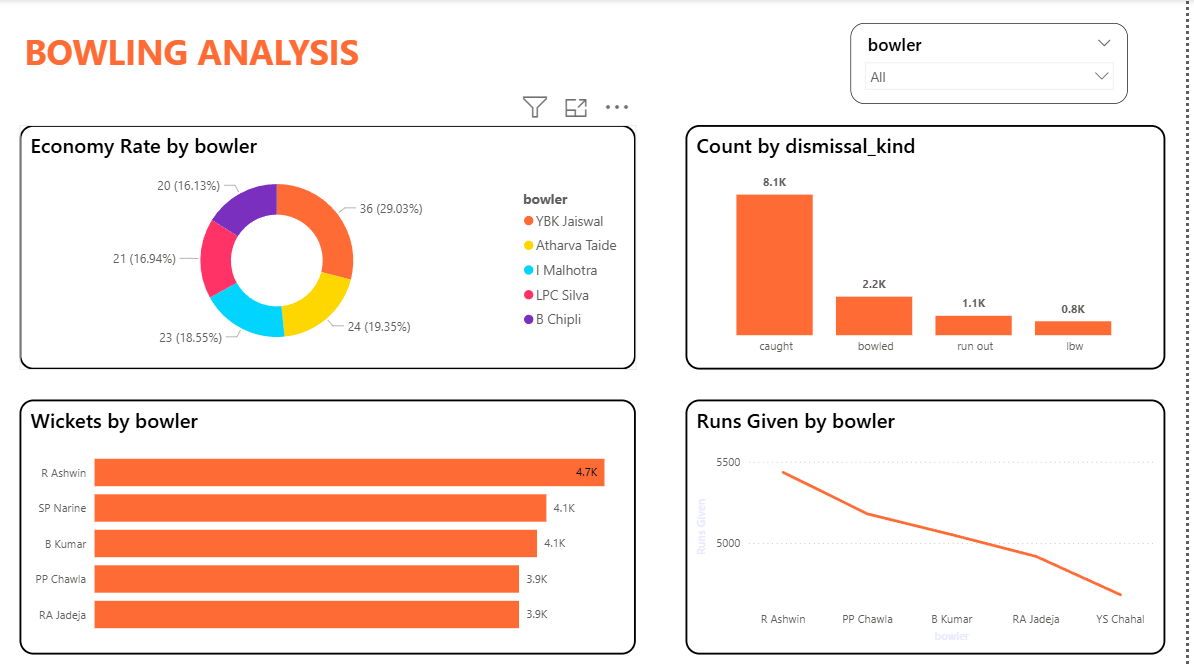
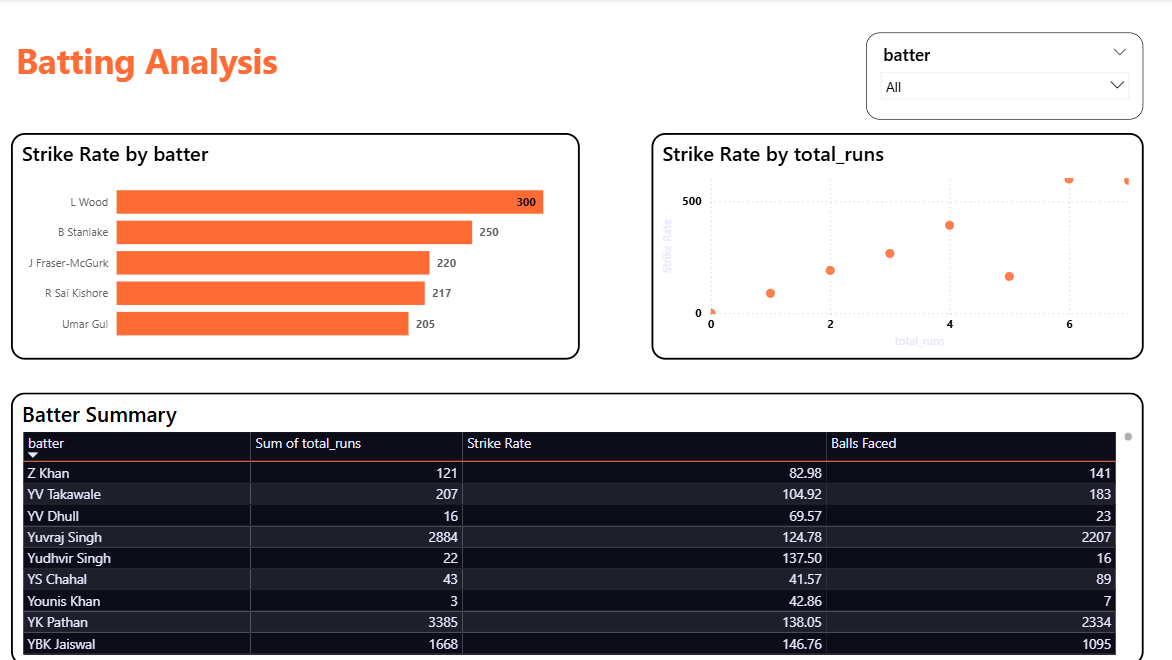
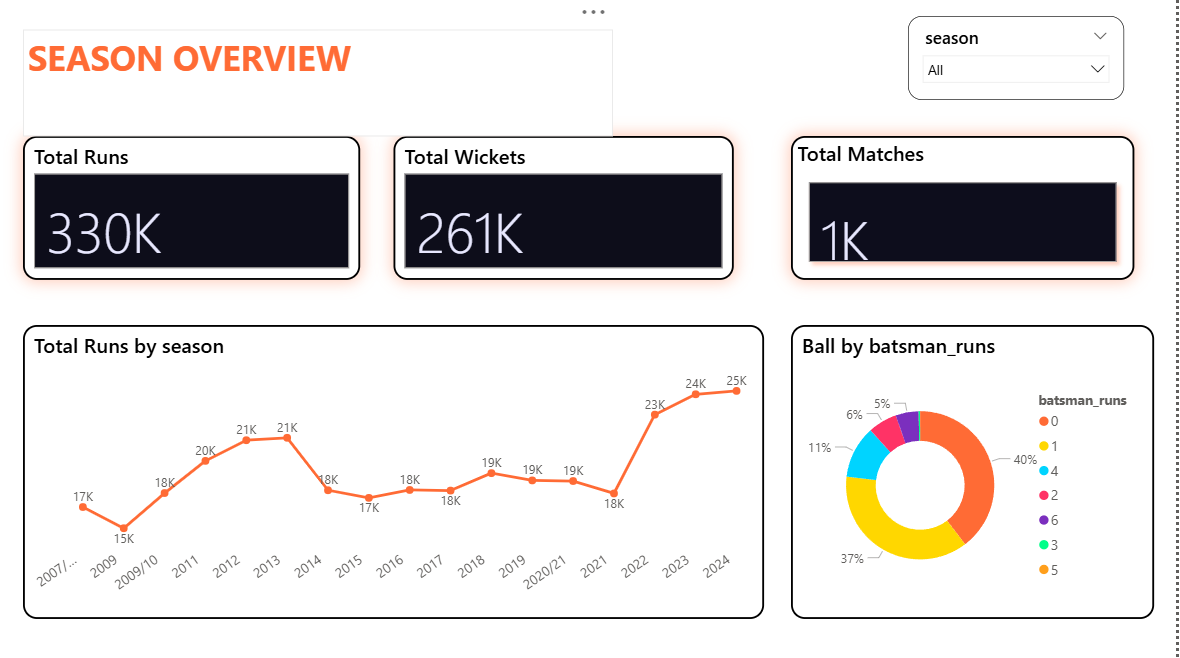
Summary The Briqlab IPL Performance Analytics Dashboard is a professional-grade Power BI solution designed to transform historical cricket data into actionable sports intelligence. This dashboard provides a comprehensive view of tournament dynamics, from team win probabilities to individual player impact, helping analysts and enthusiasts decode the patterns of the Indian Premier League. Key Tournament Performance Metrics Tournament Master KPIs: Instant snapshots of total matches, aggregate runs, wickets, and team win percentages for an immediate season overview. Team Consistency Analysis: Comparative breakdown of win/loss ratios across different venues and seasons to identify championship-winning patterns. Batting & Bowling Efficiency: Visual tracking of player strike rates, economy rates, and boundary percentages to pinpoint the league's top-performing athletes. Toss & Venue Dynamics: Data-driven insights into how toss decisions and specific stadium conditions influence final match outcomes. Player-Level Deep Dives: Granular drill-downs into individual career trajectories, allowing for a detailed evaluation of standout performers under pressure. Match-Impact Indicators: Analysis of key factors like powerplay scoring and death-over wickets that drive match-winning moments. Make it Yours Download this Briqlab template to access the underlying DAX formulas and data architecture. Simply plug in your own cricket dataset or API feed to start optimizing your sports analytics strategy today.
Interactive Demo Available
Explore this dashboard live in Power BI
Category
Templates
Chart Types
Bar, Line, Pie, Scatter Plot
Industry Types
Marketing, Information Technology
Main Colors
#FFA500
Mode
light
Version
Pro
PBIX File
🔑 Sign in to DownloadBuy this Dashboard