Published
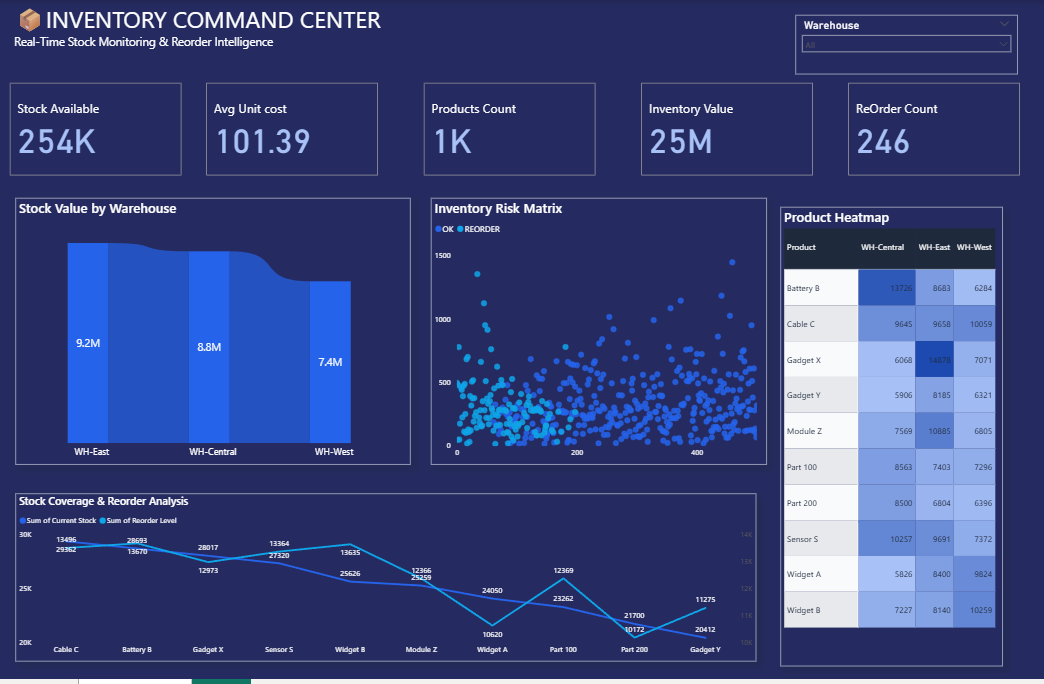
Summary: The Inventory Command Center Dashboard is a centralized Power BI solution designed to monitor inventory performance, warehouse operations, stock availability, and replenishment requirements in real time. It provides inventory managers and supply chain teams with actionable insights into stock levels, inventory valuation, warehouse distribution, and reorder risks, enabling efficient inventory control and optimized stock management. Strategic Inventory Metrics: Real-time tracking of stock availability, average unit cost, product count, inventory value, and reorder requirements. Warehouse-wise inventory value analysis to monitor stock distribution and asset allocation across storage locations. Inventory risk assessment through stock versus reorder level monitoring to identify potential stockout and replenishment risks. Product-level inventory heatmap to compare stock quantities across multiple warehouses and identify storage imbalances. Reorder analysis to evaluate inventory coverage and ensure timely replenishment of critical products. Product performance monitoring to identify fast-moving, slow-moving, and high-risk inventory items. Stock coverage trend analysis to optimize inventory levels while reducing excess holding costs. Interactive filtering by warehouse, product category, and inventory status for deeper operational insights. Make It Yours: Customize inventory KPIs to align with stock management goals, warehouse operations, and replenishment strategies. Integrate data from ERP systems, warehouse management systems (WMS), inventory databases, and procurement platforms.
Interactive Demo Available
Explore this dashboard live in Power BI
Category
Templates
Chart Types
Line, Scatter Plot
Industry Types
Inventory
Main Colors
Blue
Mode
dark
Version
Pro
PBIX File
🔑 Sign in to DownloadBuy this Dashboard