Published
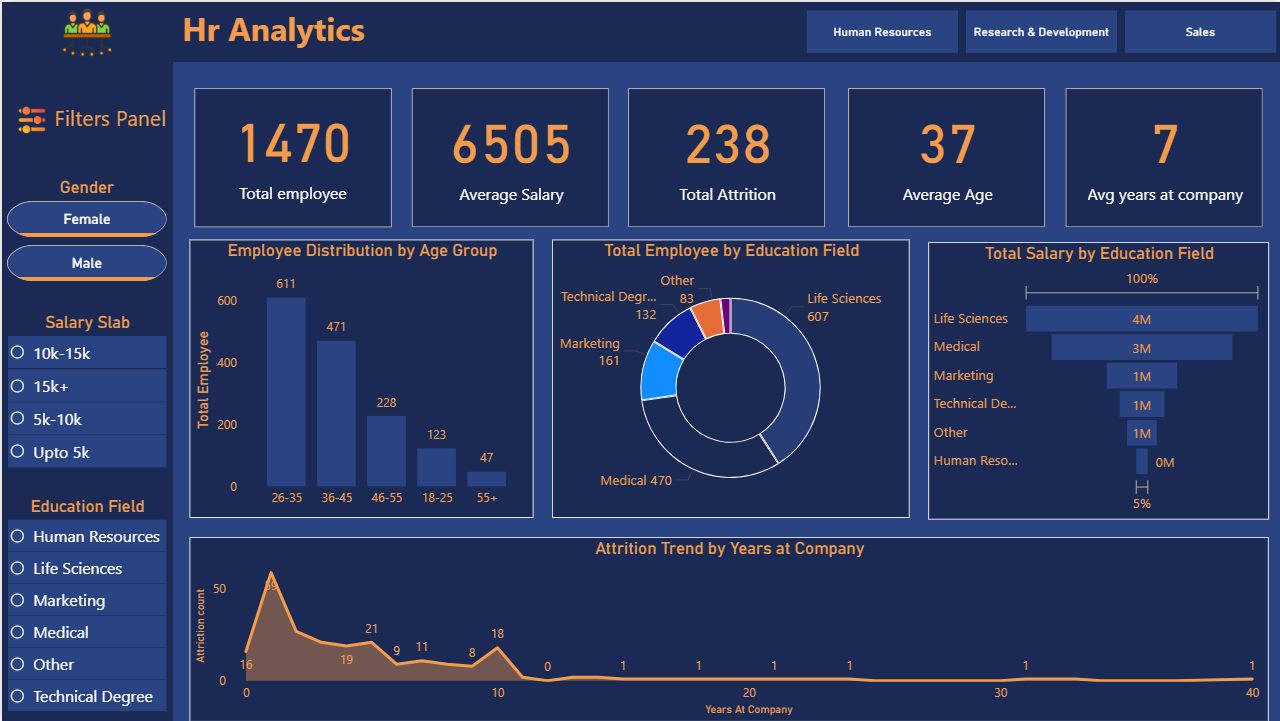
The HR Analytics Power BI Dashboard Template helps analyze workforce demographics, salary distribution, and attrition trends across employees. This HR Analytics Power BI Dashboard Template includes key metrics such as employee count by age group, salary contribution by education field, and attrition trends by years at the company to evaluate workforce performance effectively. It also highlights employee distribution across education domains and salary slabs for deeper insights. Designed for HR managers, recruiters, and people analytics teams, this HR Analytics Power BI Dashboard Template helps identify attrition patterns, optimize hiring strategies, and improve workforce planning. It solves challenges related to understanding employee behavior and managing HR data efficiently. The dashboard includes visuals such as age group distribution charts, education-wise salary analysis, attrition trend graphs, and KPI cards for quick insights. Interactive filters allow users to explore data by gender, salary slab, and education field for detailed analysis. Download this HR Analytics Power BI Dashboard Template and start analysing workforce performance and attrition trends today.
Interactive Demo Available
Explore this dashboard live in Power BI
Category
Templates
Chart Types
Bar, Line, Area, Donut
Industry Types
Finance, Information Technology
Main Colors
Blue, #294383
Mode
dark
Version
Pro
PBIX File
🔑 Sign in to DownloadBuy this Dashboard