Published
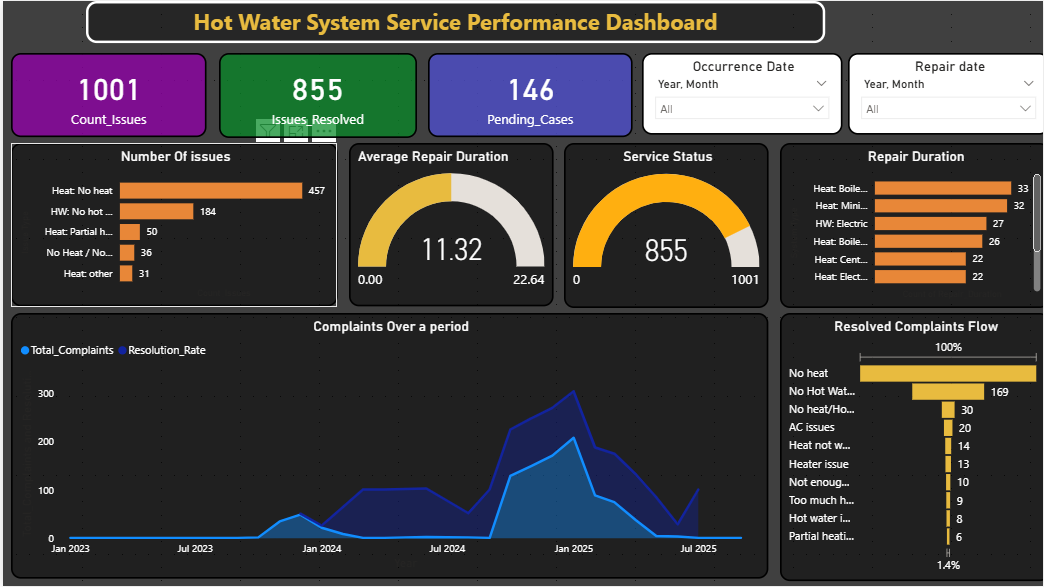
The Maintenance Service Power BI Dashboard Template helps track service requests, repair performance, and issue resolution for hot water and heating systems. This Maintenance Service Power BI Dashboard Template includes key metrics such as total issues reported, resolved cases, pending requests, and average repair duration to evaluate service efficiency. It also highlights complaint categories like no heat, hot water issues, and partial heating failures to identify recurring problems. Designed for maintenance teams, facility managers, and operations analysts, this Maintenance Service Power BI Dashboard Template helps monitor service performance, reduce resolution delays, and improve operational efficiency. It solves challenges related to tracking service requests and identifying bottlenecks in repair processes. The dashboard includes visuals such as service status tracking charts, repair duration analysis by equipment type, complaint trend graphs, and resolved issue flow visuals. Interactive filters allow users to explore data by occurrence date and repair date for detailed time-based analysis. Download this Maintenance Service Power BI Dashboard Template and start analysing service performance and repair efficiency today.
Interactive Demo Available
Explore this dashboard live in Power BI
Category
Templates
Chart Types
Bar, Gauge, Area
Industry Types
Finance, Energy
Main Colors
#202020
Mode
dark
Version
Pro
PBIX File
🔑 Sign in to DownloadBuy this Dashboard