Published
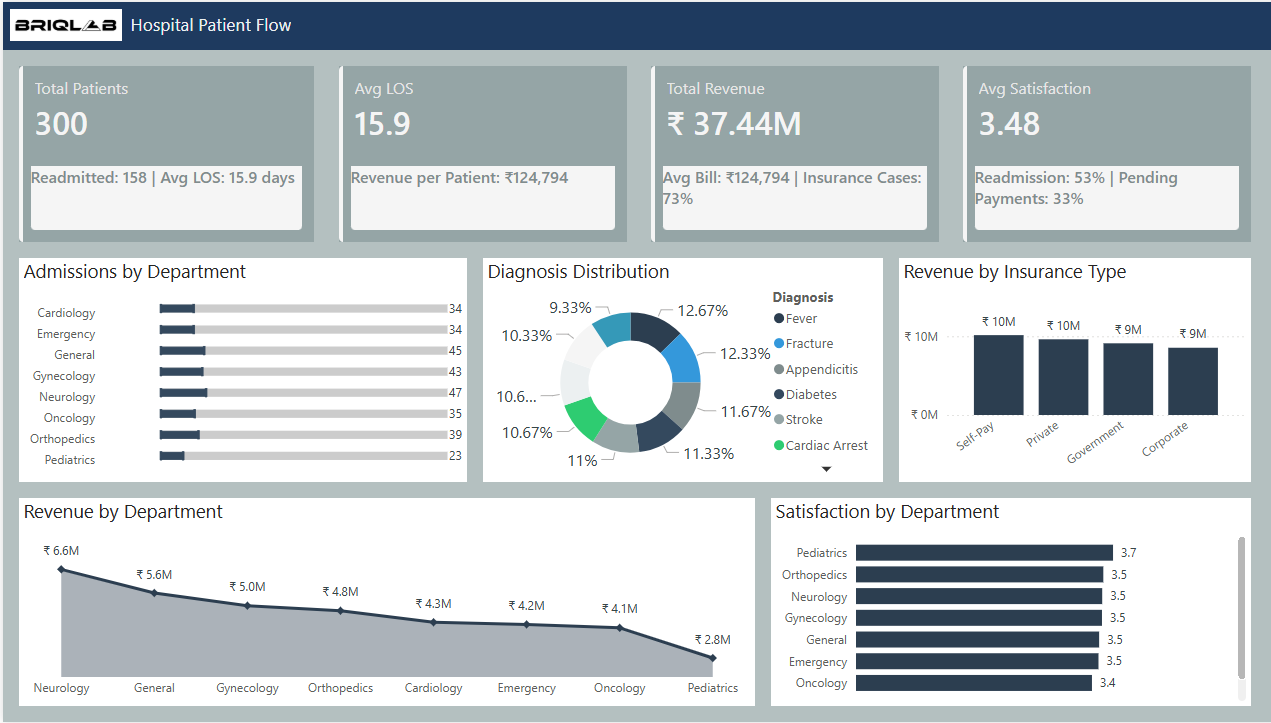
The Hospital Patient Flow Dashboard provides a comprehensive overview of hospital operations, patient admissions, revenue performance, and patient satisfaction metrics. It enables healthcare administrators to monitor patient flow, resource utilization, and financial performance in a centralized analytics interface. The dashboard highlights key performance indicators such as Total Patients, Average Length of Stay, Total Revenue, and Average Patient Satisfaction Score. These KPIs help hospital management evaluate operational efficiency and patient care outcomes. The Admissions by Department visualization shows how patients are distributed across hospital departments including Cardiology, Emergency, Neurology, and Pediatrics, helping administrators identify high-demand service areas. The Diagnosis Distribution chart provides insight into common medical conditions such as fractures, diabetes, stroke, and cardiac arrest, enabling better treatment planning and resource allocation. Financial insights are presented through Revenue by Insurance Type and Revenue by Department, which help hospitals track revenue sources such as self-pay, private insurance, and government coverage. Additionally, the Patient Satisfaction by Department visualization helps identify departments with higher patient satisfaction levels.
Category
Templates
Chart Types
Bar, Area, Donut
Industry Types
Healthcare
Main Colors
#B4C0C0
Mode
light
Version
Free
PBIX File
🔑 Sign in to Download