Published
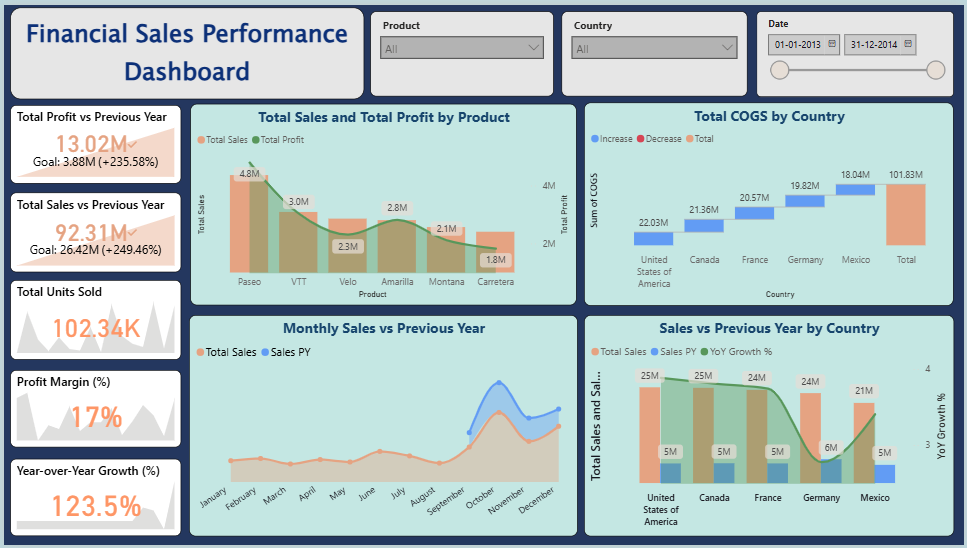
Analyse and present your organisation's complete financial picture with this Financial Sales Performance Power BI dashboard template, built to give finance teams, sales leaders, and executives a structured, interactive view of revenue health, profitability, and growth trends in one place. The dashboard tracks all critical financial KPIs including total sales, total profit, units sold, profit margin, and year-over-year growth — with direct benchmarking against previous year performance to surface trends and flag areas of concern instantly. Additional metrics cover product-level revenue contribution, cost of goods sold analysis by country, and monthly sales trend patterns, helping finance and strategy teams pinpoint exactly where margin is being made or lost across markets and product lines. This template is designed for CFOs, financial analysts, sales directors, and business leaders who need a reliable, presentation-ready tool for executive reviews, board reporting, and strategic performance discussions. Visuals include KPI summary scorecards, product contribution bar charts, country-wise COGS comparison tables, YoY growth trend lines, and monthly sales pattern charts — all featuring dynamic slicers for product, country, and date range to enable precise, drill-down analysis. Everything is built natively in Power BI Desktop with no external tools or plugins required. Download this Financial Sales Performance Power BI dashboard template, open the PBIX file in Power BI Desktop, and start tracking your financial performance with clarity today.
Interactive Demo Available
Explore this dashboard live in Power BI
Category
Templates
Chart Types
Bar, Line
Industry Types
Finance, Sales
Main Colors
Blue, Yellow, #243A5E
Mode
dark
Version
Pro
PBIX File
🔑 Sign in to DownloadBuy this Dashboard