Published
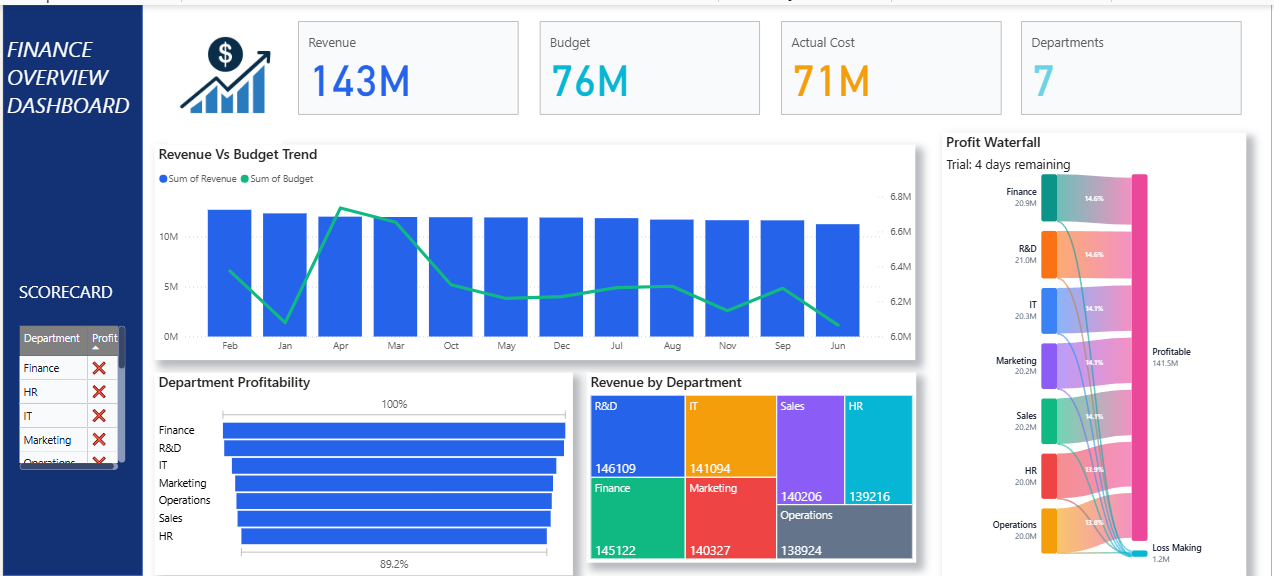
Summary: The Finance Overview Dashboard is a centralized Power BI solution designed to monitor financial performance, budget utilization, departmental profitability, and organizational cost management. It provides finance leaders and business stakeholders with real-time visibility into revenue generation, budget allocation, operational expenses, and profit contribution across departments, enabling informed financial planning and strategic decision-making. Strategic Financial Metrics: Real-time tracking of total revenue, budget allocation, actual costs, and departmental performance. Revenue versus budget analysis to evaluate financial performance against planned targets and identify variances. Department profitability monitoring to assess the contribution of each department toward organizational profitability. Revenue distribution analysis by department to identify key revenue-generating business units. Cost and expense visibility to support effective budget management and operational control. Profit waterfall analysis to understand the impact of departmental performance on overall profitability. Departmental scorecard tracking to compare financial outcomes and identify areas requiring improvement. Interactive filtering by department, period, and financial category for deeper financial analysis and reporting. Make It Yours: Customize financial KPIs to align with organizational goals, budgeting strategies, and profitability objectives. Integrate data from ERP systems, accounting software, financial databases, and enterprise planning applications.
Interactive Demo Available
Explore this dashboard live in Power BI
Category
Templates
Chart Types
Line, Area, Tree Map / Hierarchical Chart
Industry Types
Finance
Main Colors
Blue
Mode
light
Version
Pro
PBIX File
🔑 Sign in to DownloadBuy this Dashboard