Published
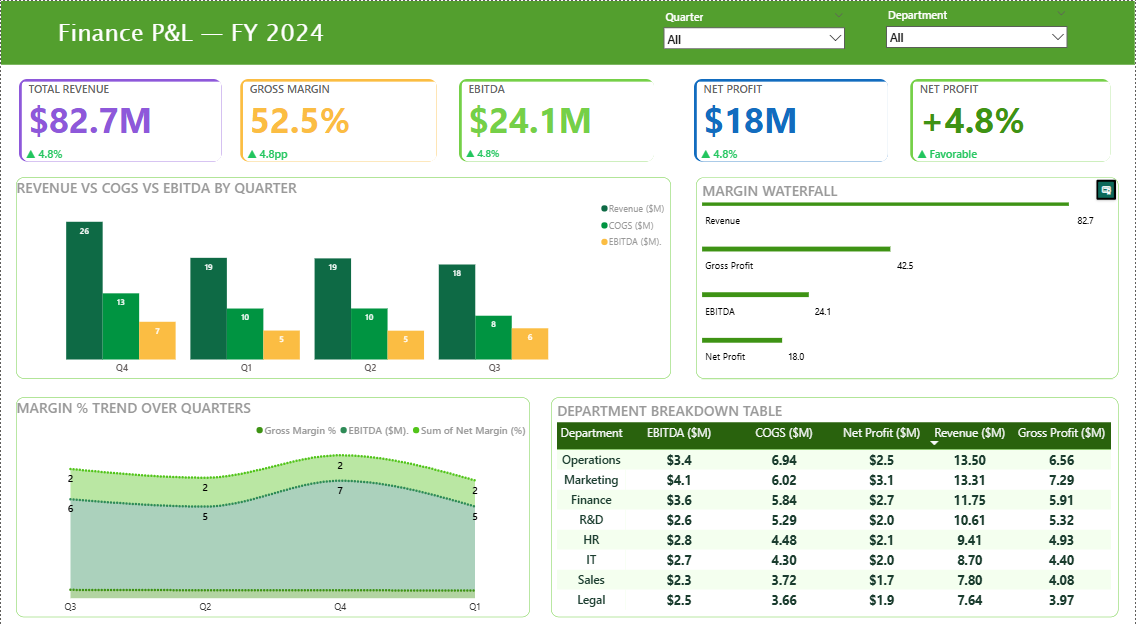
Analyse and monitor financial performance with this Finance Analytics Power BI dashboard template built for tracking profitability and key business metrics. This Finance Analytics Power BI dashboard template highlights essential KPIs such as revenue trends, profit margins, cost analysis, and financial performance indicators. It also enables users to evaluate business outcomes, identify patterns, and track financial health over time. This Finance Analytics Power BI dashboard template is ideal for finance teams, business leaders, and analysts who need clear insights into financial data to support strategic decisions. It helps uncover trends, improve financial planning, and ensure better control over business performance. The dashboard includes KPI cards, profitability trend charts, revenue breakdown visuals, and interactive filters for detailed financial analysis. Clean and intuitive visuals make it easy to explore data and gain actionable insights quickly within Power BI. Download this Finance Analytics Power BI dashboard template and start tracking your financial performance with clarity and confidence.
Category
Templates
Chart Types
Bar, Line
Industry Types
Finance
Main Colors
Green, Yellow, #FFFFFF
Mode
light
Version
Pro
PBIX File
🔑 Sign in to DownloadBuy this Dashboard