Published
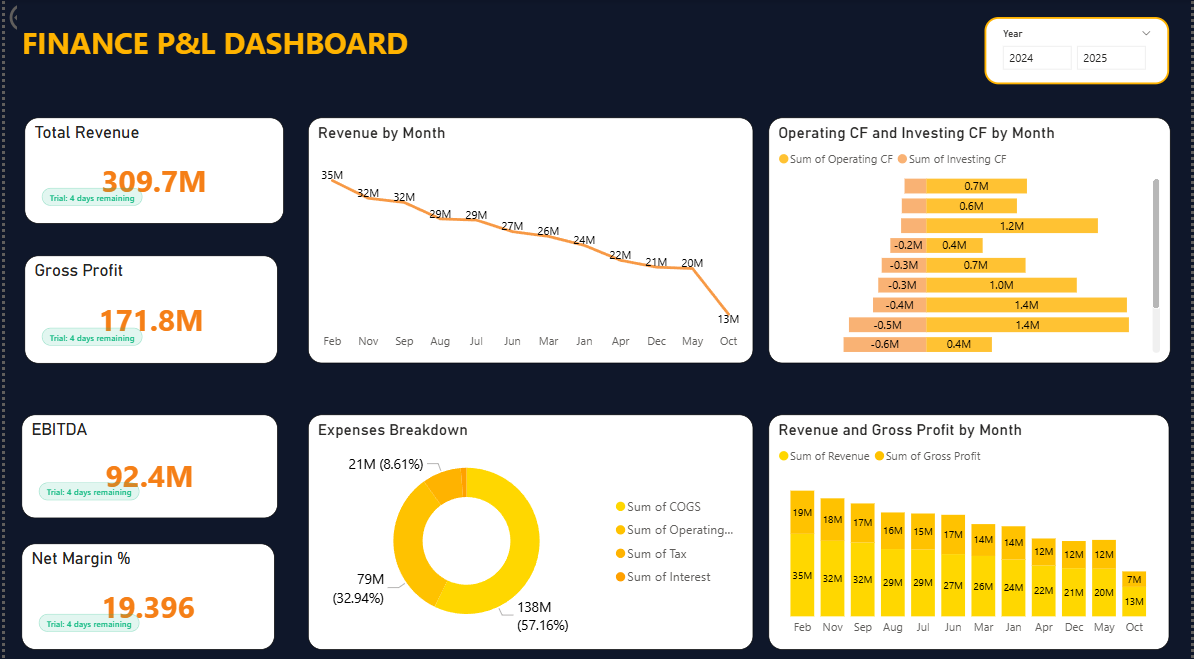
Summary The Briqlab Finance P&L & Financial Health Dashboard is a professional-grade Power BI solution engineered for CFOs, Finance Controllers, and FP&A Analysts who require a single source of truth. This dashboard transforms complex accounting data into actionable financial intelligence, providing real-time visibility into profitability, cash flow, and balance sheet health in a boardroom-ready interface. Key Financial Performance Metrics Comprehensive P&L Analysis: Instant snapshots of Revenue, COGS, and Gross Profit with integrated margin percentage tracking. Profitability Benchmarking: Precision calculation and visualization of EBITDA, EBIT, and Net Profit trends to monitor long-term fiscal health. OpEx Breakdown: Granular categorization of operating expenses to identify cost-saving opportunities and budget variances. Cash Flow & Balance Sheet Health: Data-driven insights into liquidity, cash positioning, and core financial ratios for total balance sheet transparency. Budget vs. Actual Monitoring: Real-time variance analysis to help Finance Controllers keep departmental spending aligned with strategic goals. Net Margin Trend Analysis: High-impact time-series visualizations to track margin fluctuations and profitability drivers over fiscal periods. Make it Yours Download this Briqlab template to access the underlying DAX formulas and data architecture. Designed for seamless integration with SAP, Tally, Zoho Books, or QuickBooks, you can simply plug in your own ERP or accounting data to start driving data-backed financial decisions today.
Interactive Demo Available
Explore this dashboard live in Power BI
Category
Templates
Chart Types
Bar, Donut
Industry Types
Finance, Retail, Marketing
Main Colors
Yellow
Mode
dark
Version
Pro
PBIX File
🔑 Sign in to DownloadBuy this Dashboard