Published
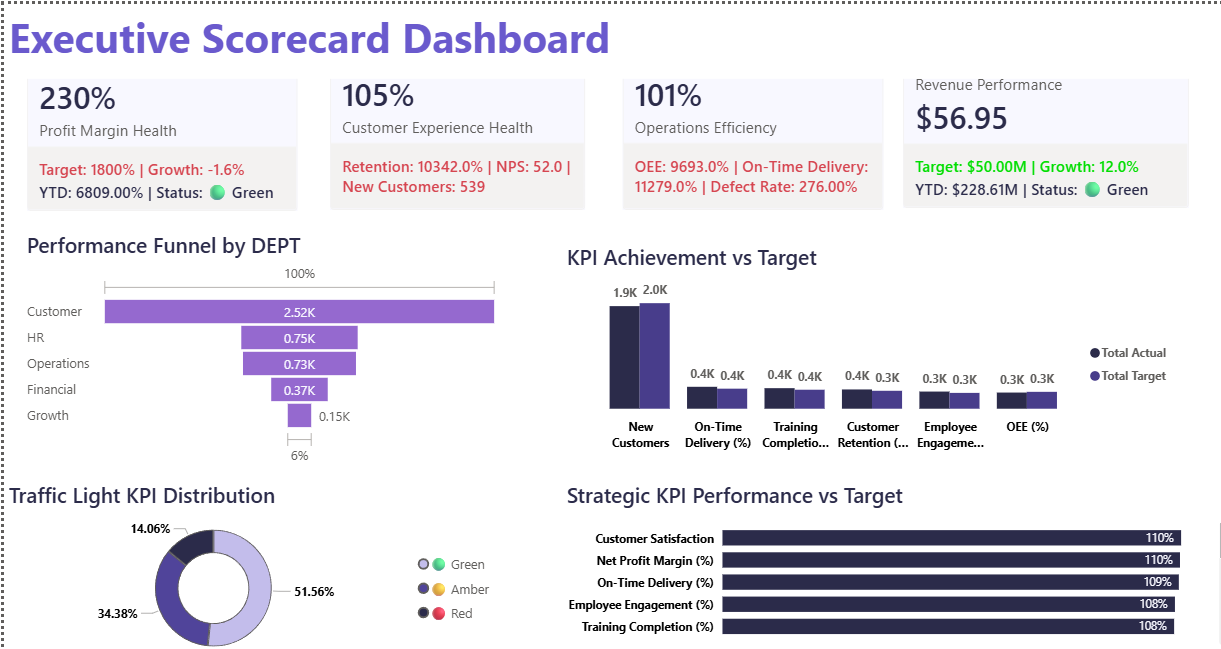
Monitor your organization's most critical business metrics with this Executive Scorecard Power BI dashboard template, designed to give senior leaders a fast, accurate view of company-wide performance. The dashboard tracks four core performance pillars: profit margin health, revenue performance, customer experience, and operational efficiency — consolidated into a single, easy-to-read executive view. Key KPIs include profit margin trends, revenue vs target comparisons, customer satisfaction scores, operational output rates, and overall KPI achievement percentages across departments. This template is built for CEOs, CFOs, COOs, and senior business leaders who need to stay on top of strategic targets, spot underperforming areas quickly, and present performance data clearly to boards and stakeholders. Visuals include KPI achievement scorecards, departmental performance comparisons, revenue trend line charts, profit margin indicators, and customer experience gauges — all built natively inside Power BI Desktop with no external tools or plugins required. Whether used for weekly leadership reviews or monthly board reporting, this dashboard turns complex business data into clear, actionable insight. Download this Executive Scorecard Power BI dashboard template, open the PBIX file directly in Power BI Desktop, and start tracking your strategic KPIs today.
Interactive Demo Available
Explore this dashboard live in Power BI
Category
Templates
Chart Types
Bar, Donut
Industry Types
Finance, Marketing, Information Technology
Main Colors
#9569CF
Mode
light
Version
Pro
PBIX File
🔑 Sign in to DownloadBuy this Dashboard