Published
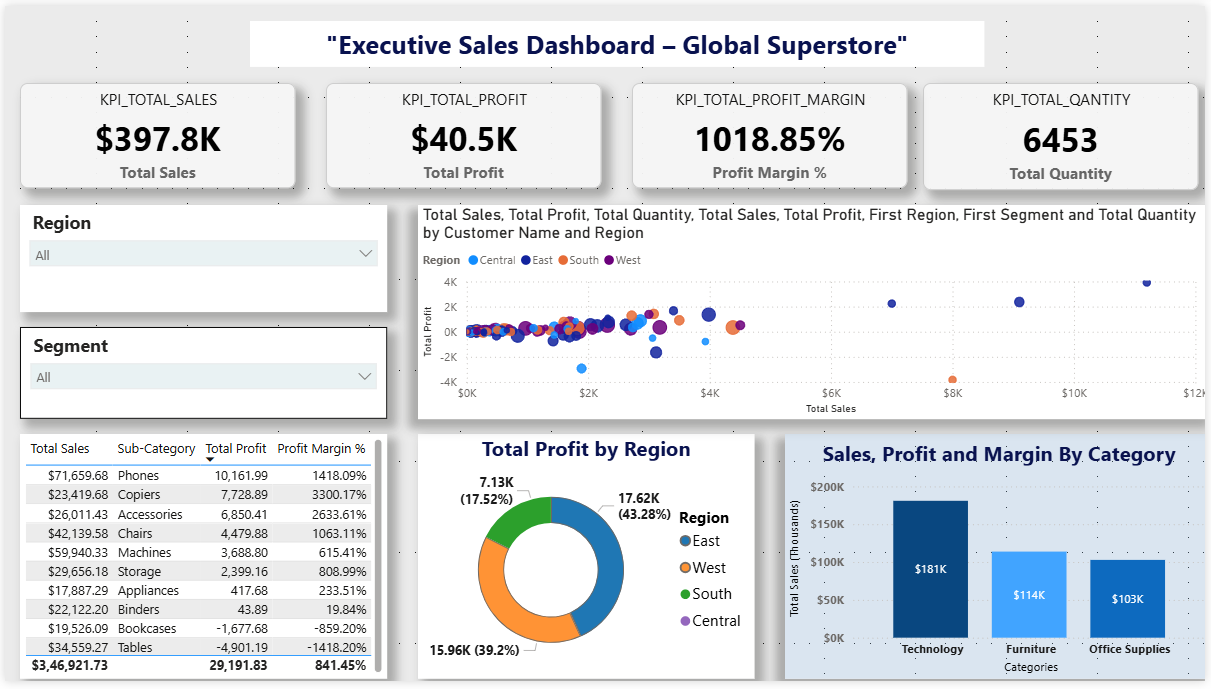
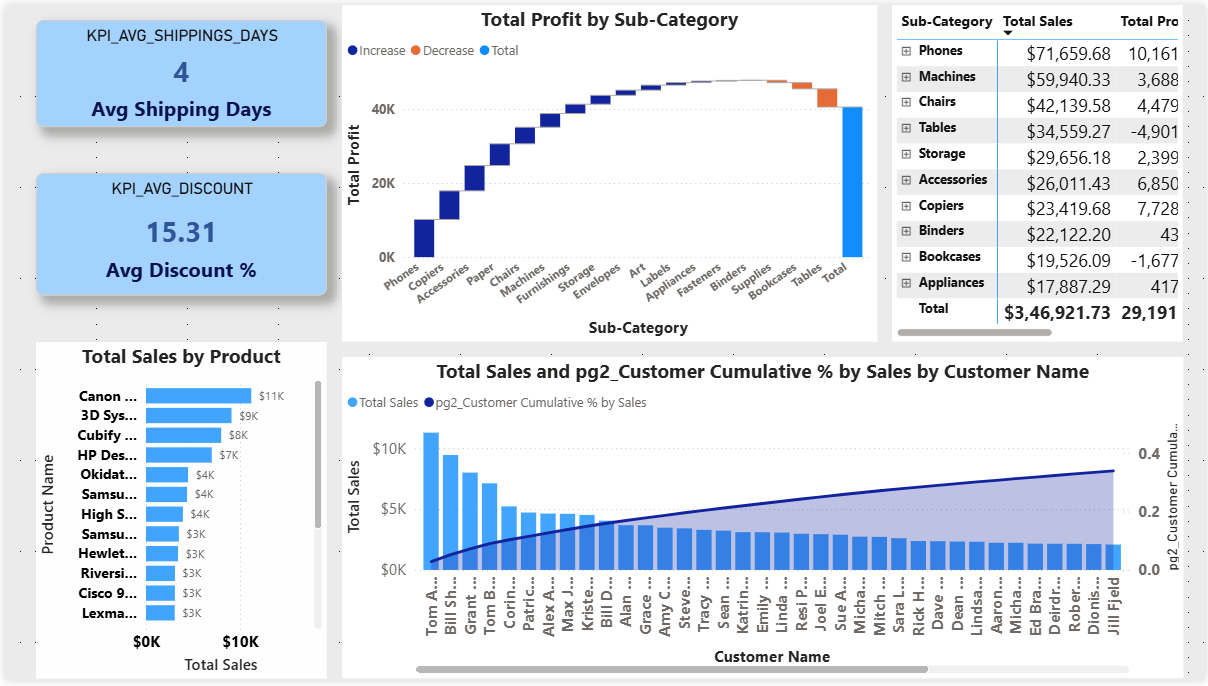
The Executive Sales Power BI Dashboard Template helps businesses track sales performance, profitability, and customer trends across regions and product categories. This Executive Sales Power BI Dashboard Template includes key metrics such as total sales, total profit, profit margin, and total quantity to evaluate business performance effectively. It also highlights customer segmentation, regional sales distribution, and category-wise performance across technology, furniture, and office supplies. Designed for executives, sales managers, and business analysts, this Executive Sales Power BI Dashboard Template helps identify high-performing regions, top customers, and areas with declining profitability. It solves challenges related to tracking revenue growth, understanding customer behavior, and improving strategic decision-making. The dashboard features visuals such as profit by region charts, customer-level sales analysis, category comparison bar charts, and KPI cards for quick insights. Interactive filters allow users to explore data by region and segment for deeper analysis. Download this Executive Sales Power BI Dashboard Template and start analysing your sales performance and profitability trends today.
Interactive Demo Available
Explore this dashboard live in Power BI
Category
Templates
Chart Types
Bar, Scatter Plot, Donut
Industry Types
Retail, Marketing
Main Colors
#EBEBEB
Mode
light
Version
Pro
PBIX File
🔑 Sign in to DownloadBuy this Dashboard