Published
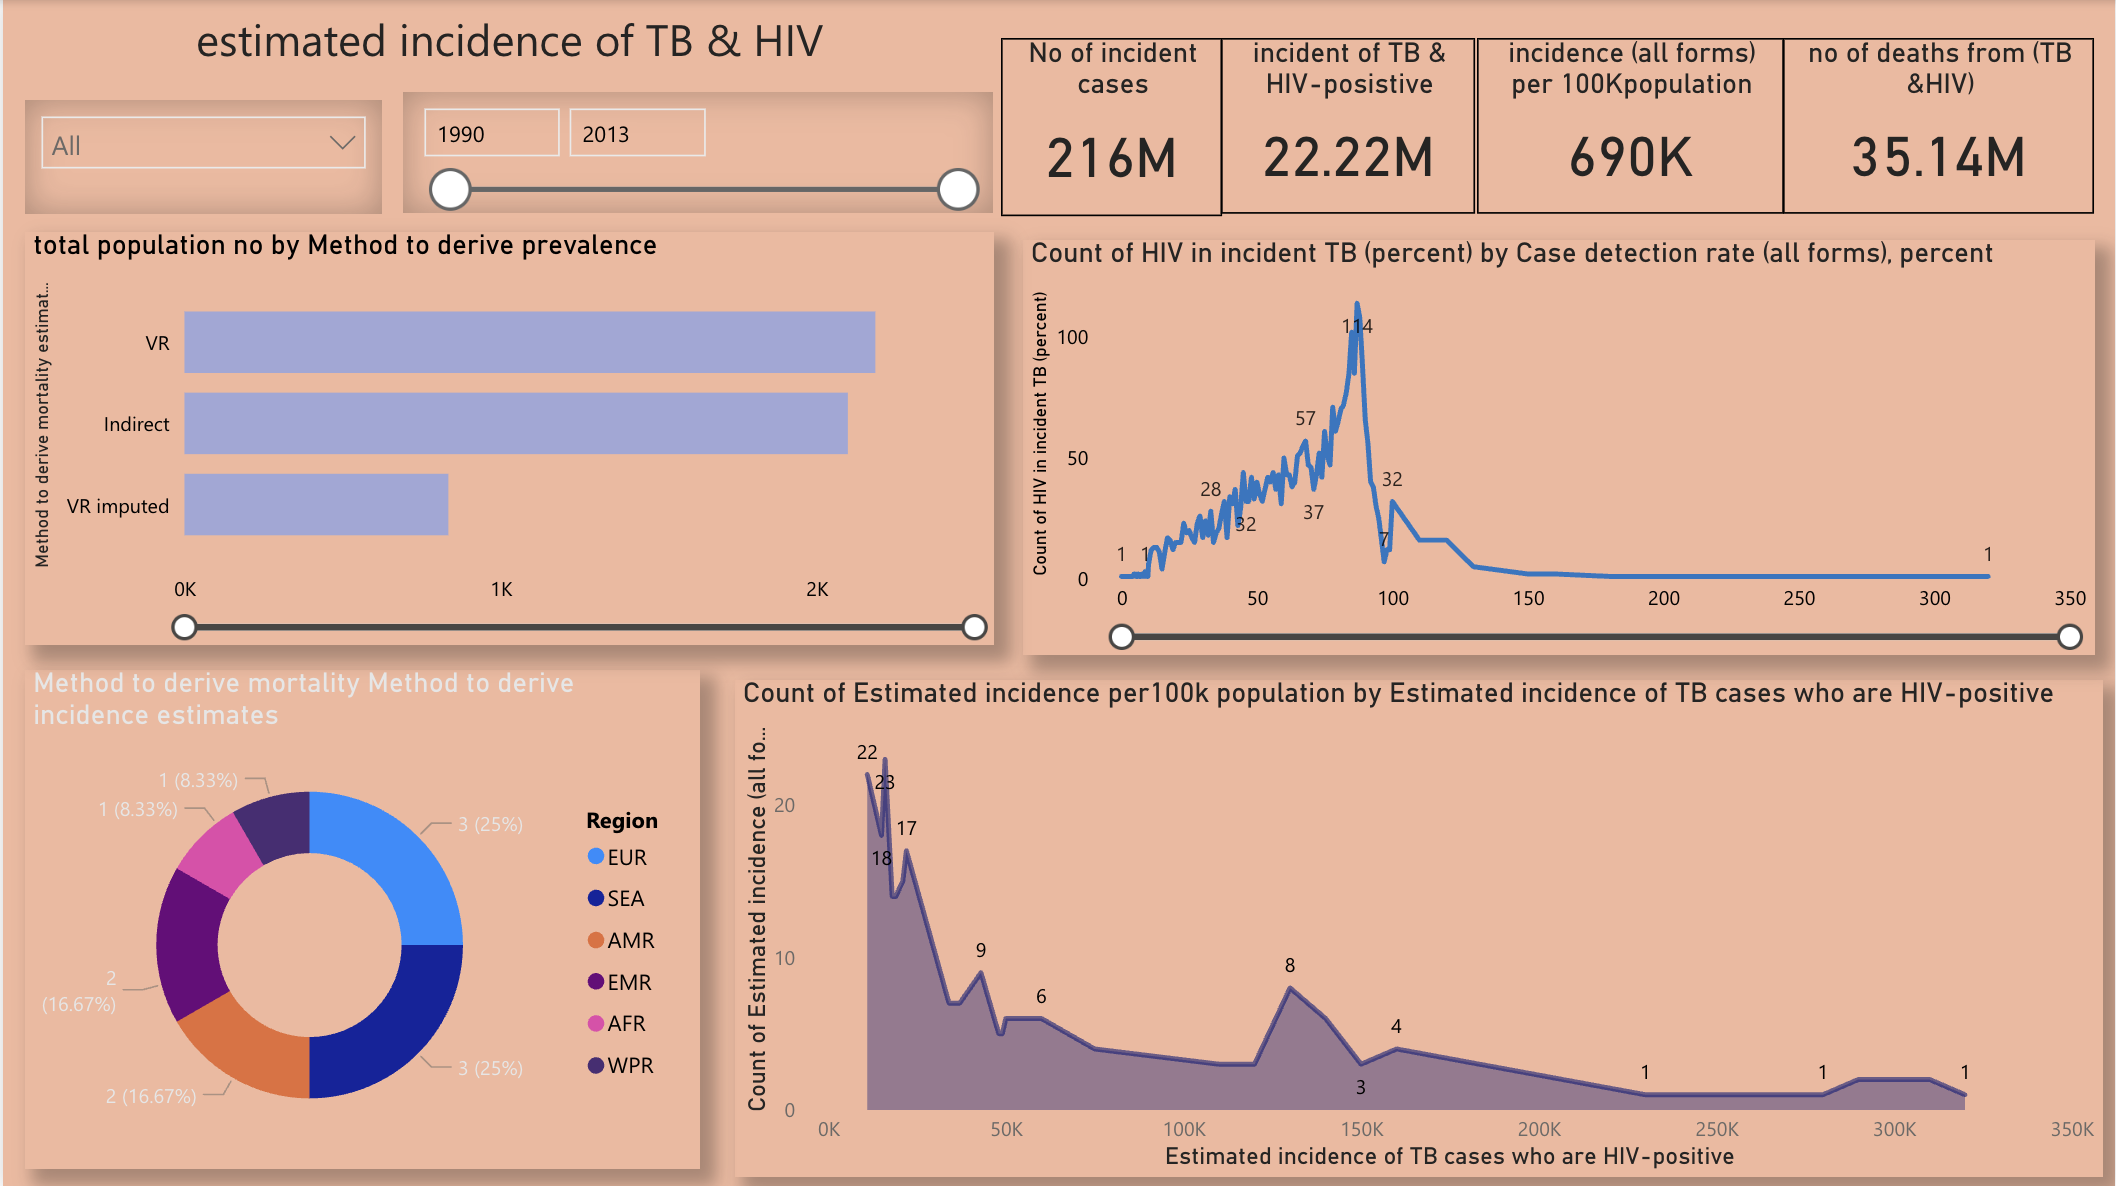
Track global disease trends with this Healthcare TB HIV Analytics Power BI dashboard template designed for monitoring incidence and co-infection patterns. This Healthcare TB HIV Analytics Power BI dashboard template highlights key metrics such as total TB cases, HIV-positive TB cases, incidence per 100,000 population, and mortality figures across regions and years. It also enables analysis of long-term trends, prevalence rates, and relationships between TB and HIV populations. This Healthcare TB HIV Analytics Power BI dashboard template is ideal for public health professionals, researchers, and policy analysts who need reliable insights into disease patterns and health outcomes. It helps identify high-risk regions, evaluate intervention strategies, and support data-driven health policy decisions. The dashboard includes trend line charts for incidence and mortality, regional comparison visuals, prevalence distribution charts, and detailed KPI cards for quick insights. Interactive filters for year and region allow flexible exploration of epidemiological data over time. Download this Healthcare TB HIV Analytics Power BI dashboard template and start analysing disease trends and public health performance effectively.
Interactive Demo Available
Explore this dashboard live in Power BI
Category
Templates
Chart Types
Bar, Line, Area, Donut
Industry Types
Healthcare
Main Colors
#FFA500
Mode
light
Version
Free
PBIX File
🔑 Sign in to Download