Published
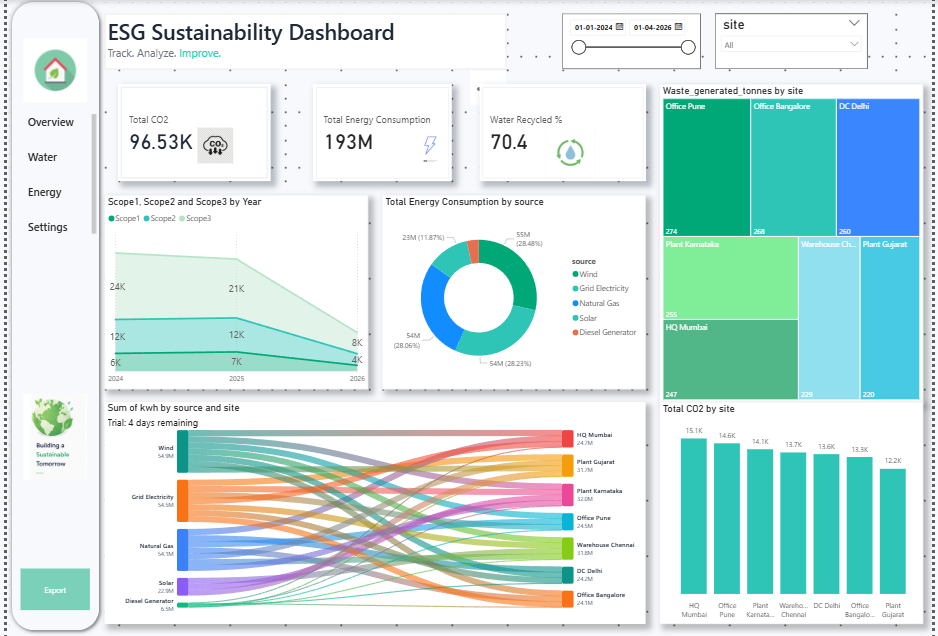
Summary: The Briqlab ESG Sustainability Dashboard is an interactive Power BI solution built to monitor and optimize environmental performance across business locations. It provides a centralized view of CO₂ emissions, energy consumption, water recycling, and waste generation to support smarter sustainability decisions. Strategic Sustainability Metrics: ESG KPI tracking for CO₂, energy usage, and water recycling Scope 1, 2, and 3 emissions trend analysis Energy consumption insights by renewable and non-renewable sources Site-wise comparison of waste generation and carbon output Sankey flow visualization for energy distribution across locations Make it Yours: Download this Briqlab template to access the underlying Power BI model, DAX calculations, and visual architecture. Connect your own ESG datasets to start building data-driven sustainability strategies today.
Interactive Demo Available
Explore this dashboard live in Power BI
Category
Templates
Chart Types
Area, Tree Map / Hierarchical Chart, Donut
Industry Types
Energy
Main Colors
Green
Mode
light
Version
Pro
PBIX File
🔑 Sign in to DownloadBuy this Dashboard