Published
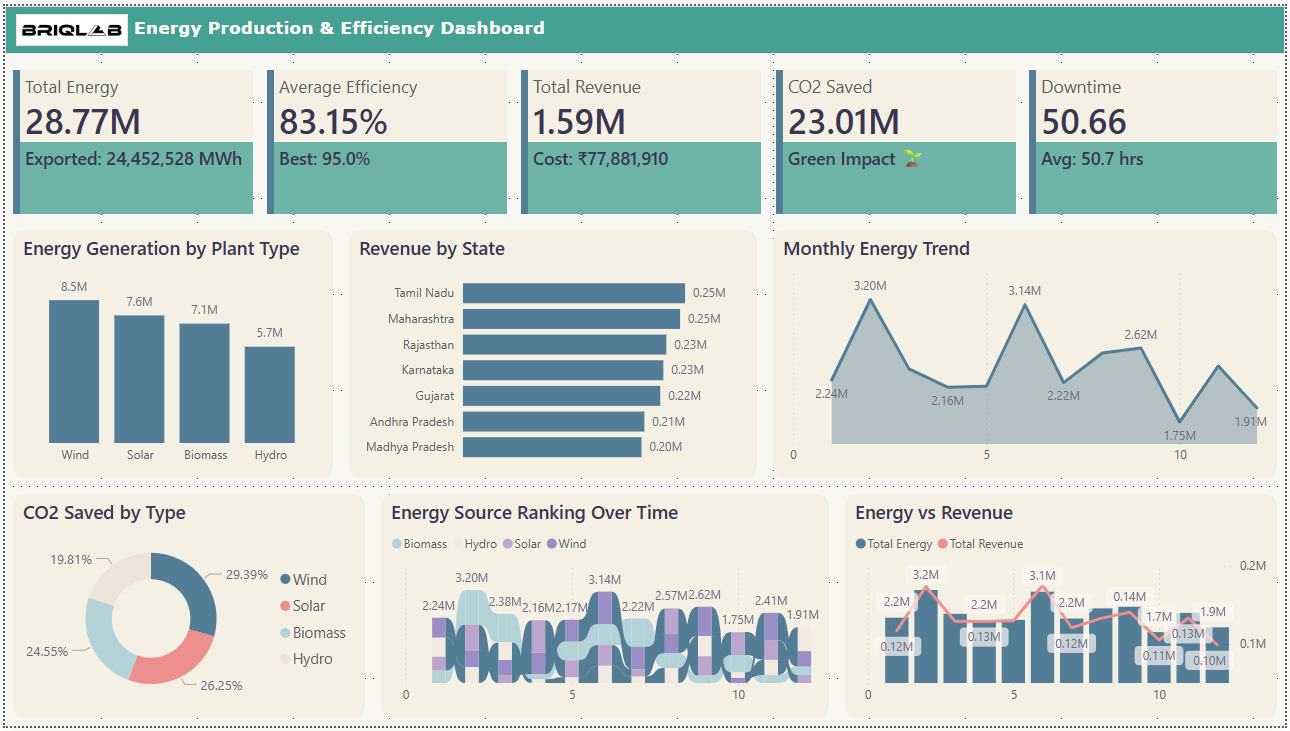
The Energy Production & Efficiency Dashboard provides a comprehensive view of energy generation, operational efficiency, revenue performance, and environmental impact across multiple energy sources and regions. It enables organizations to monitor power production and optimize energy utilization while supporting sustainability goals. This dashboard is designed for energy companies, plant managers, sustainability analysts, and government agencies who require data-driven insights to improve energy efficiency, maximize revenue, and promote environmentally responsible energy production.
Category
Templates
Chart Types
Bar, Line, Donut
Industry Types
Education, Energy
Main Colors
#F4F0E4
Mode
light
Version
Pro
PBIX File
🔑 Sign in to DownloadBuy this Dashboard