Published
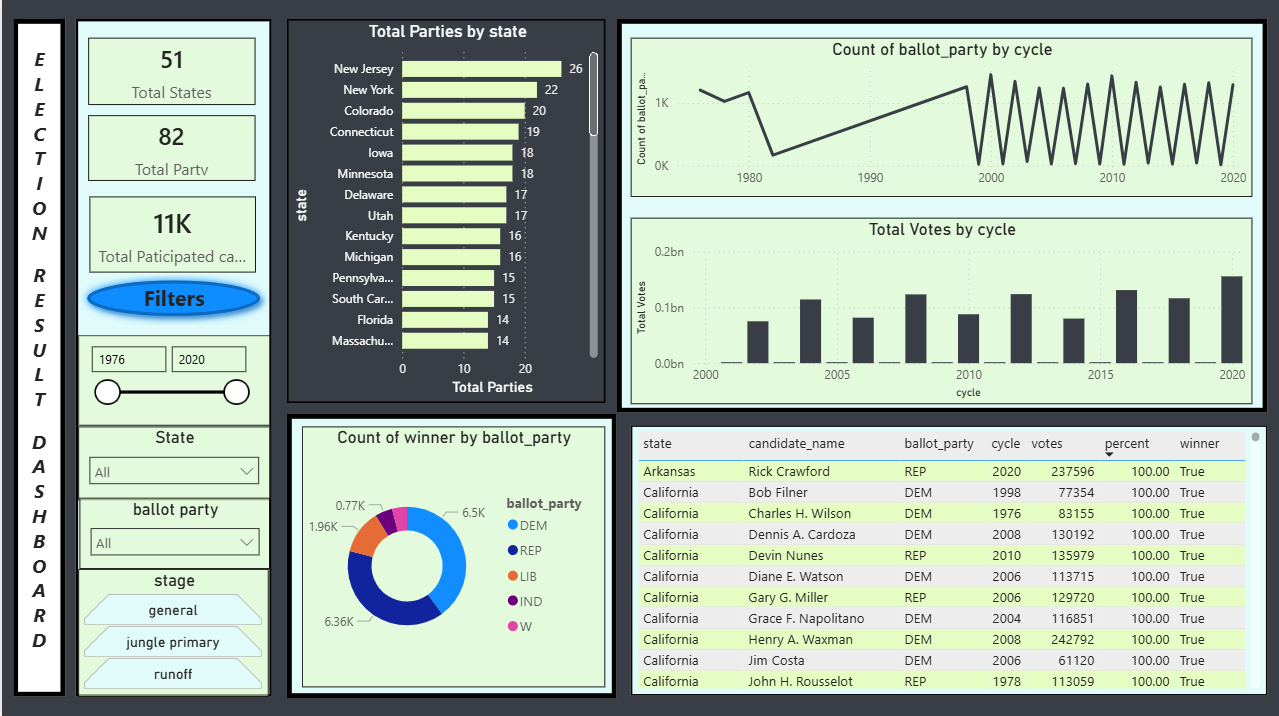
Analyse voting patterns and political performance with this Election Results Power BI dashboard template designed for multi-state election analysis. This Election Results Power BI dashboard template tracks key metrics such as total states, number of parties, participating candidates, and total votes across election cycles. It also highlights party distribution, ballot participation trends, and vote growth over time to support deeper political insights. This Election Results Power BI dashboard template is ideal for political analysts, researchers, media teams, and data professionals who need to explore election data across regions and time periods. It helps users identify voting trends, compare party performance, and evaluate election outcomes efficiently. The dashboard includes bar charts for party distribution by state, line charts for participation trends, column charts for vote totals by cycle, donut charts for winning party share, and detailed tables for candidate-level analysis. Interactive filters for year, state, party, and election stage allow flexible and dynamic exploration. Download this Election Results Power BI dashboard template and start analysing election trends and political performance with clarity.
Interactive Demo Available
Explore this dashboard live in Power BI
Category
Templates
Chart Types
Bar, Line, Donut
Industry Types
Political Analysis
Main Colors
Blue, Green, #E5FCC2
Mode
light
Version
Free
PBIX File
🔑 Sign in to Download