.png)
.png)
Published
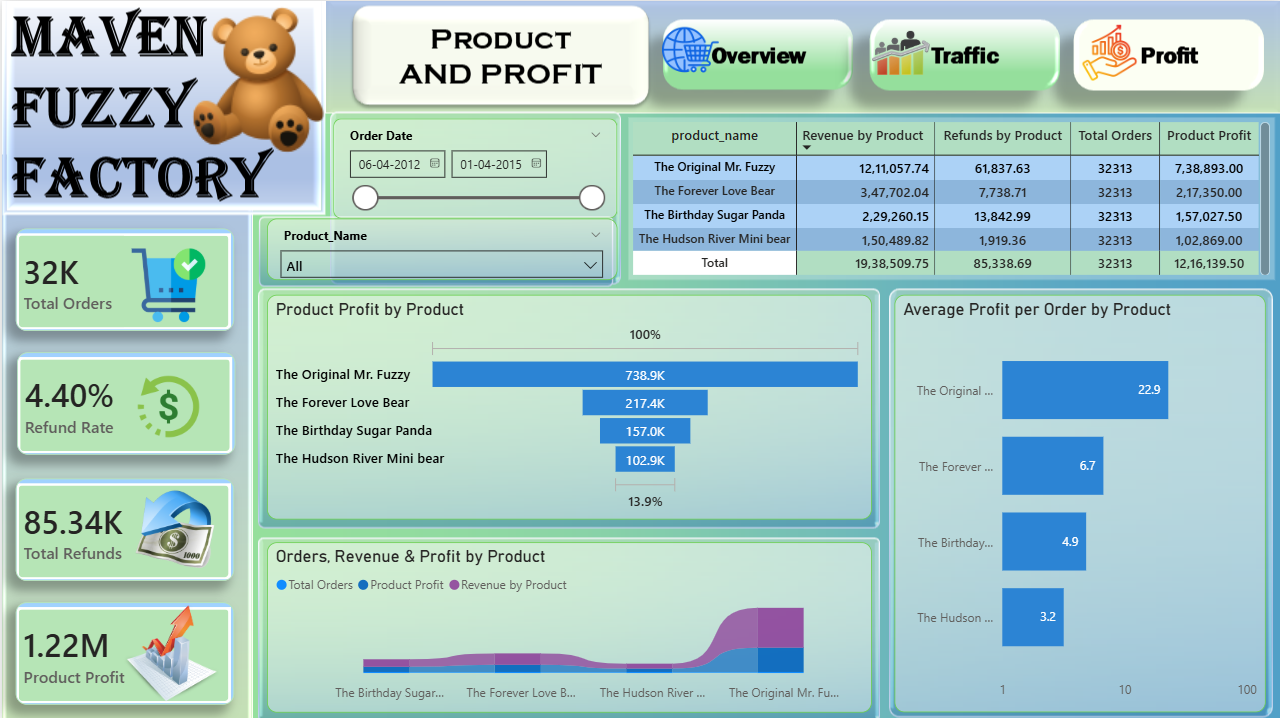
The Ecommerce Business Power BI Dashboard Template helps analyze business performance, product profitability, and customer traffic trends for Maven Fuzzy Factory. This Ecommerce Business Power BI Dashboard Template includes key metrics such as total orders, revenue, gross profit, refund rate, conversion rate, sessions, and profit margin to track overall performance. It also highlights product-level insights, traffic source performance, device-based analysis, and monthly trends. Designed for ecommerce managers, analysts, and marketing teams, this Ecommerce Business Power BI Dashboard Template helps identify top-performing products, optimize marketing channels, and improve conversion rates. It solves challenges related to scattered sales and traffic data while providing clear visibility into business growth. The dashboard includes visuals such as bar charts, line charts, area charts, donut charts, waterfall charts, and detailed tables for performance tracking. Interactive filters allow users to explore data by date, product, traffic source, device type, and year. Download this Ecommerce Business Power BI Dashboard Template and start analysing your business performance and conversion trends today.
Interactive Demo Available
Explore this dashboard live in Power BI
Category
Templates
Chart Types
Bar, Line, Area, Donut
Industry Types
Retail, E-commerce
Main Colors
Blue, Green, #6BCF4F
Mode
light
Version
Pro
PBIX File
🔑 Sign in to DownloadBuy this Dashboard