Published
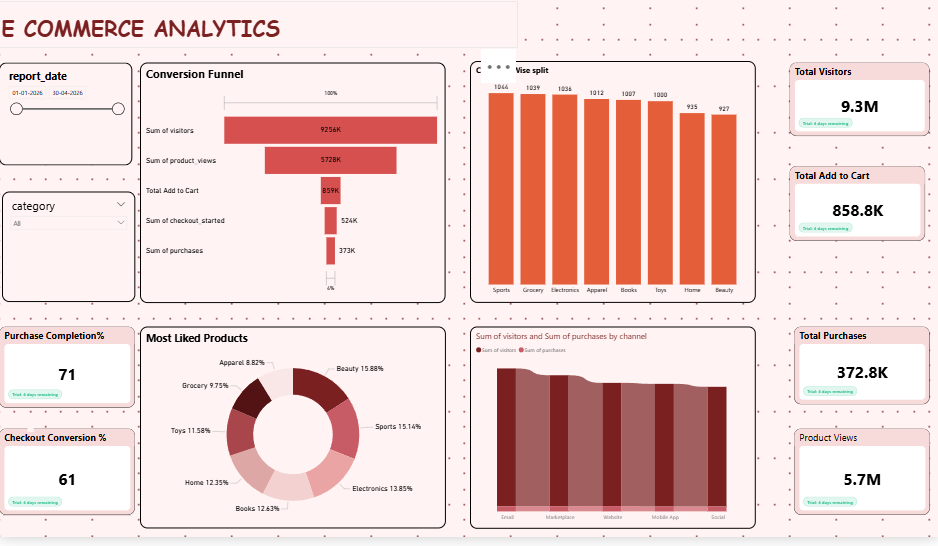
Summary: The Briqlab E-Commerce Analytics Dashboard is a modern Power BI solution designed to monitor online retail performance, customer purchase behavior, and sales conversion trends. It provides a centralized view of visitor engagement, checkout efficiency, product demand, and channel performance to help businesses optimize digital commerce strategies and improve revenue growth. Strategic E-Commerce Metrics: Real-time tracking of total visitors, product views, add-to-cart actions, and completed purchases Conversion funnel analysis to identify customer drop-offs from product discovery to final purchase Category-wise visitor split insights across Sports, Grocery, Electronics, Apparel, Books, Toys, Home, and Beauty Checkout and purchase completion percentage monitoring for sales optimization Product popularity analysis highlighting the most liked product categories Channel-based visitor and purchase performance across Email, Marketplace, Website, Mobile App, and Social platforms Make it Yours: Download this Briqlab template to access the complete Power BI model, DAX measures, and visual design architecture. Connect your own e-commerce or retail datasets to uncover actionable insights, improve customer conversion, and build smarter digital commerce strategies today.
Interactive Demo Available
Explore this dashboard live in Power BI
Category
Templates
Chart Types
Bar, Donut
Industry Types
E-commerce
Main Colors
Red
Mode
light
Version
Pro
PBIX File
🔑 Sign in to DownloadBuy this Dashboard