Published
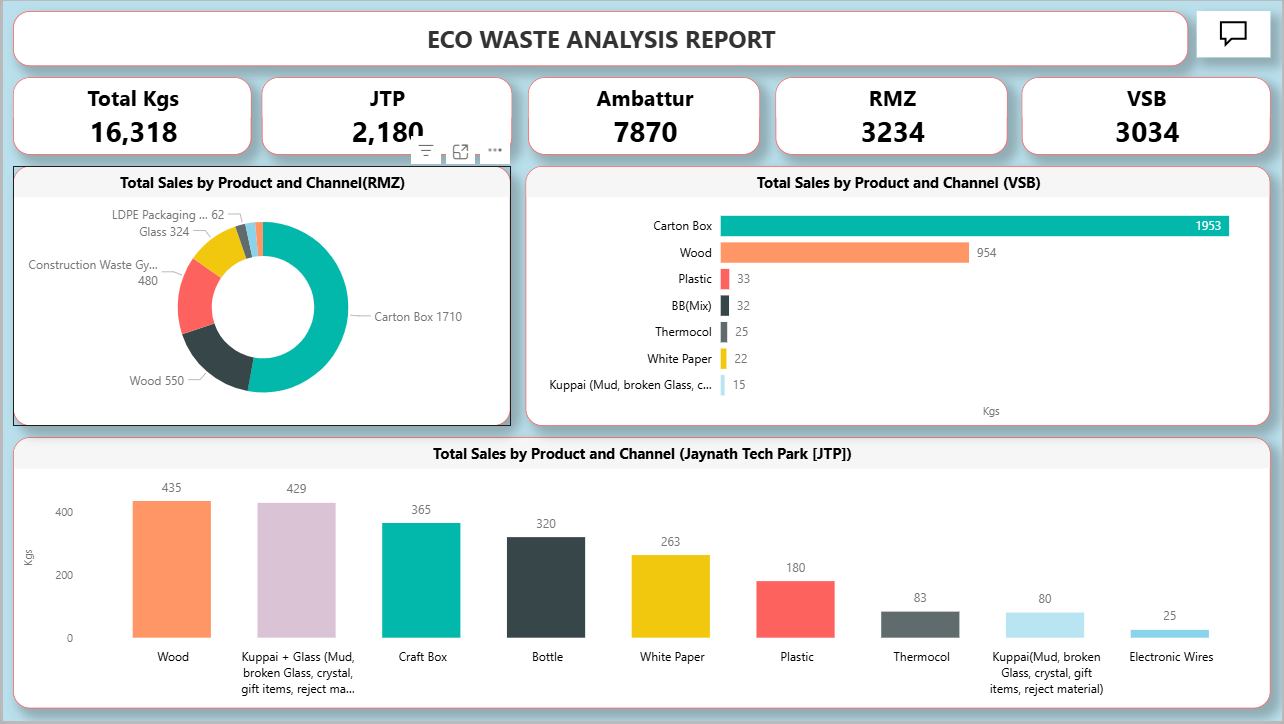
The Waste Management Power BI Dashboard Template helps analyze waste generation, distribution, and composition across multiple locations. This Waste Management Power BI Dashboard Template includes key metrics such as total waste generated, waste by product type, and location-wise distribution to evaluate sustainability performance effectively. It also highlights waste categories such as carton boxes, wood, plastic, glass, paper, thermocol, and electronic waste. Designed for sustainability teams, facility managers, and environmental analysts, this Waste Management Power BI Dashboard Template helps identify major waste contributors, optimize recycling strategies, and improve waste management planning. It solves challenges related to tracking waste patterns and comparing environmental performance across sites. The dashboard includes visuals such as waste distribution charts, location comparison graphs, category breakdown visuals, and KPI cards for quick insights. Interactive filters allow users to explore data by location and waste type for deeper analysis. Download this Waste Management Power BI Dashboard Template and start analysing waste generation and sustainability trends today.
Interactive Demo Available
Explore this dashboard live in Power BI
Category
Templates
Chart Types
Bar, Donut
Industry Types
Energy, Agriculture & Food
Main Colors
Green, #FFFFFF
Mode
light
Version
Pro
PBIX File
🔑 Sign in to DownloadBuy this Dashboard