Published
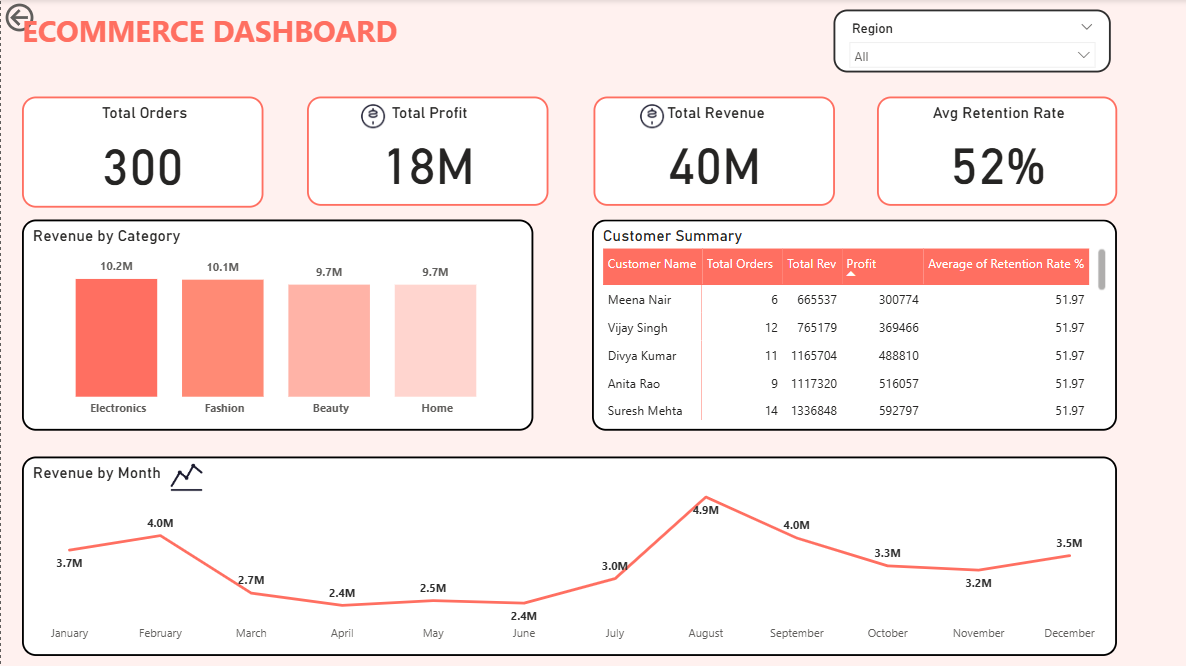
Summary The Briqlab E-commerce Growth Analytics Dashboard is a professional-grade Power BI solution engineered for E-commerce Managers, Growth Analysts, and Category Managers who require real-time visibility into their digital storefront. This dashboard transforms transactional data into actionable e-commerce intelligence, providing a clear view of sales velocity, customer loyalty, and category performance in one unified, interactive interface. Key E-commerce Performance Metrics Core Growth KPIs: Instant snapshots of total orders, revenue, and net profit for a real-time assessment of business health and GMV trends. Customer Loyalty & Retention: Precision tracking of average retention rates at both a global and individual customer level to measure long-term brand stickiness. Category Performance Benchmarking: Granular breakdown of revenue across Electronics, Fashion, Beauty, and Home to optimize inventory and marketing focus. Seasonality & Trend Analysis: High-impact monthly revenue visualizations to identify peak sales periods and emerging consumer patterns. Customer-Level Deep Dives: Detailed profiles of top-tier customers, including total orders, individual revenue contribution, and profitability. Dynamic Regional Filtering: Interactive tools to segment performance by geography, allowing for targeted local promotions and logistics planning. Make it Yours Download this Briqlab template to access the underlying DAX formulas and data architecture. Designed for seamless integration with Shopify, WooCommerce, Unicommerce, or Excel, you can simply plug in your own order data to start optimizing your e-commerce growth strategy today.
Interactive Demo Available
Explore this dashboard live in Power BI
Category
Templates
Chart Types
Bar, Line
Industry Types
Finance, Retail, Marketing
Main Colors
#FF6F61
Mode
light
Version
Pro
PBIX File
🔑 Sign in to DownloadBuy this Dashboard