Published
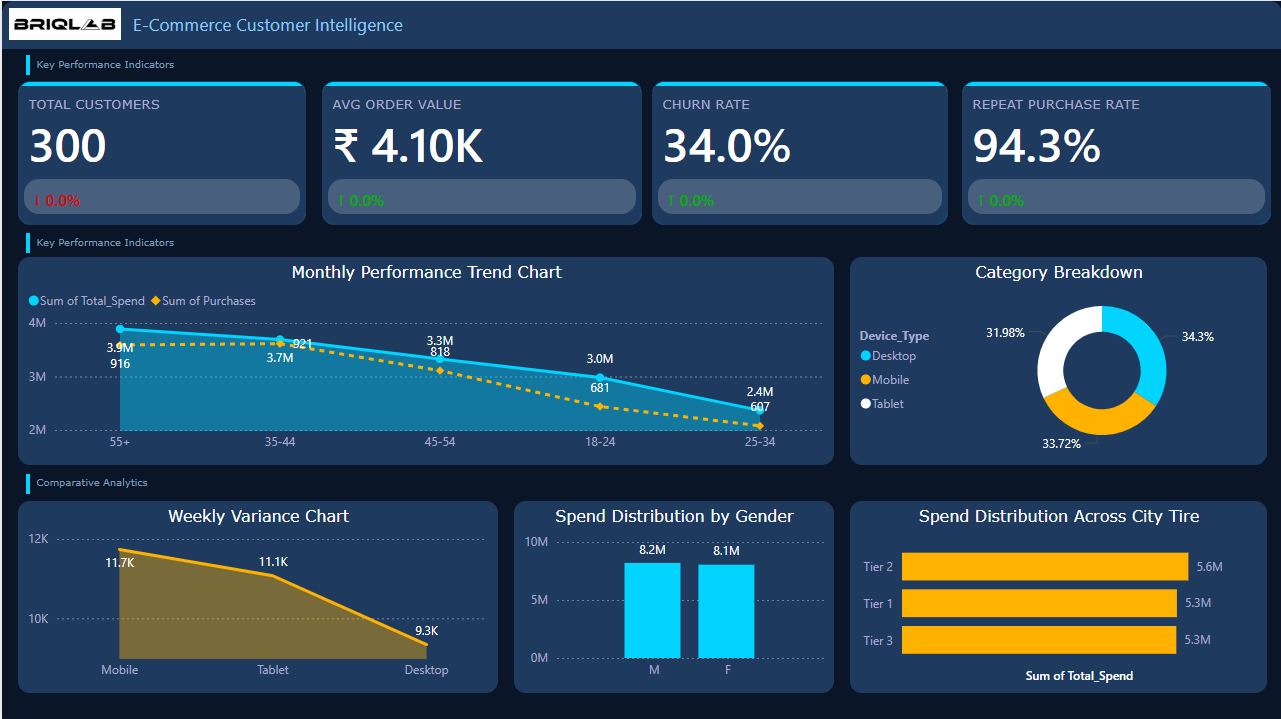
The E-Commerce Customer Intelligence Dashboard provides a comprehensive analysis of customer behavior, purchasing patterns, and revenue performance for an online retail platform. This dashboard enables businesses to monitor key customer metrics and understand how different demographic segments contribute to overall sales performance. Key performance indicators include Total Customers, Average Order Value, Churn Rate, and Repeat Purchase Rate, offering a quick overview of customer retention and purchasing efficiency. The Monthly Performance Trend Chart analyzes spending and purchase behavior across age groups, helping businesses identify high-value customer segments. The Category Breakdown visual highlights the distribution of customer activity across different device types such as Desktop, Mobile, and Tablet, providing insights into platform usage trends. Additional analytics include the Weekly Variance Chart, which tracks device-based purchase fluctuations, and Spend Distribution by Gender, which helps understand purchasing behavior between male and female customers. The dashboard also includes Spend Distribution Across City Tiers, enabling analysis of spending patterns in Tier-1, Tier-2, and Tier-3 cities. Overall, this dashboard supports customer segmentation, marketing strategy optimization, and data-driven e-commerce decision-making.
Category
Templates
Chart Types
Bar, Line, Area, Donut
Industry Types
Finance, Marketing
Main Colors
Blue, #1E3A5F
Mode
dark
Version
Pro
PBIX File
🔑 Sign in to DownloadBuy this Dashboard