Published
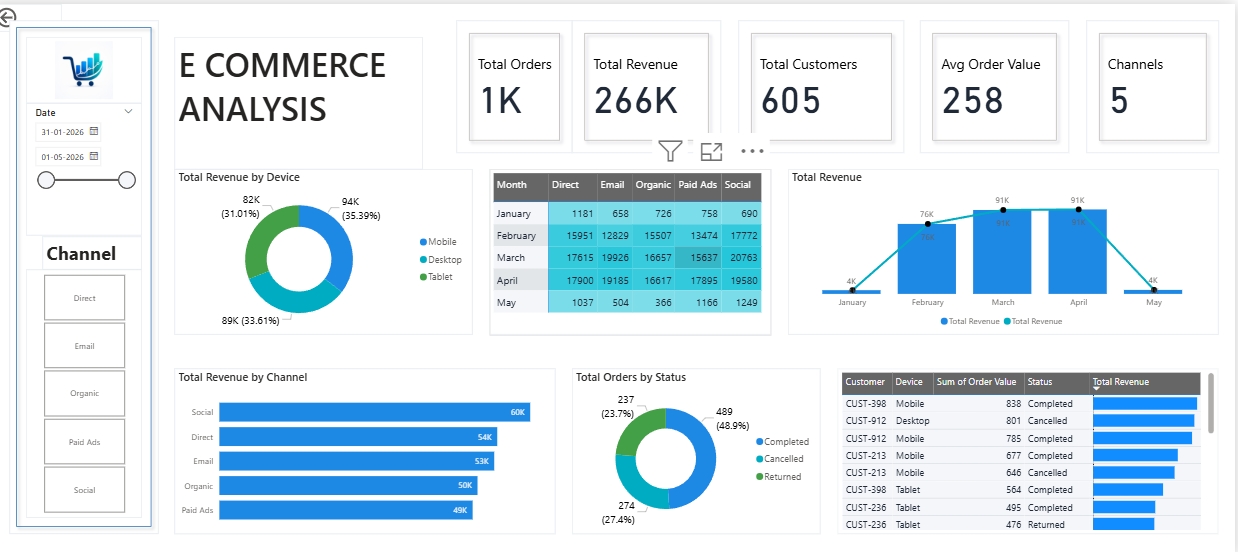
Summary: The Briqlab E-Commerce Analysis Dashboard is a comprehensive Power BI solution designed to monitor sales performance, customer behavior, revenue trends, and order management across multiple sales channels. It provides a centralized view of key e-commerce metrics, helping businesses optimize operations, improve customer experience, and drive revenue growth through data-driven decision-making. Strategic E-Commerce Metrics: Real-time tracking of Total Orders, Revenue, Customers, Average Order Value, and Sales Channels Revenue distribution analysis across Mobile, Desktop, and Tablet devices Channel-wise performance monitoring for Direct, Email, Organic, Paid Ads, and Social traffic sources Monthly revenue trend analysis to identify seasonal patterns and business growth opportunities Order status tracking across Completed, Cancelled, and Returned orders Customer-level transaction insights with detailed order value and revenue contribution analysis Multi-channel marketing performance evaluation to measure acquisition effectiveness Interactive filtering capabilities for customized reporting and deeper business exploration Make it Yours: Download this Briqlab template to access the complete Power BI model, DAX measures, and visual design architecture. Connect your own e-commerce, retail, marketplace, or online business datasets to uncover actionable insights, improve operational efficiency, increase customer retention, and accelerate business growth with confidence.
Category
Templates
Chart Types
Bar, Donut
Industry Types
E-commerce
Main Colors
Blue
Mode
light
Version
Pro
PBIX File
🔑 Sign in to DownloadBuy this Dashboard