Published
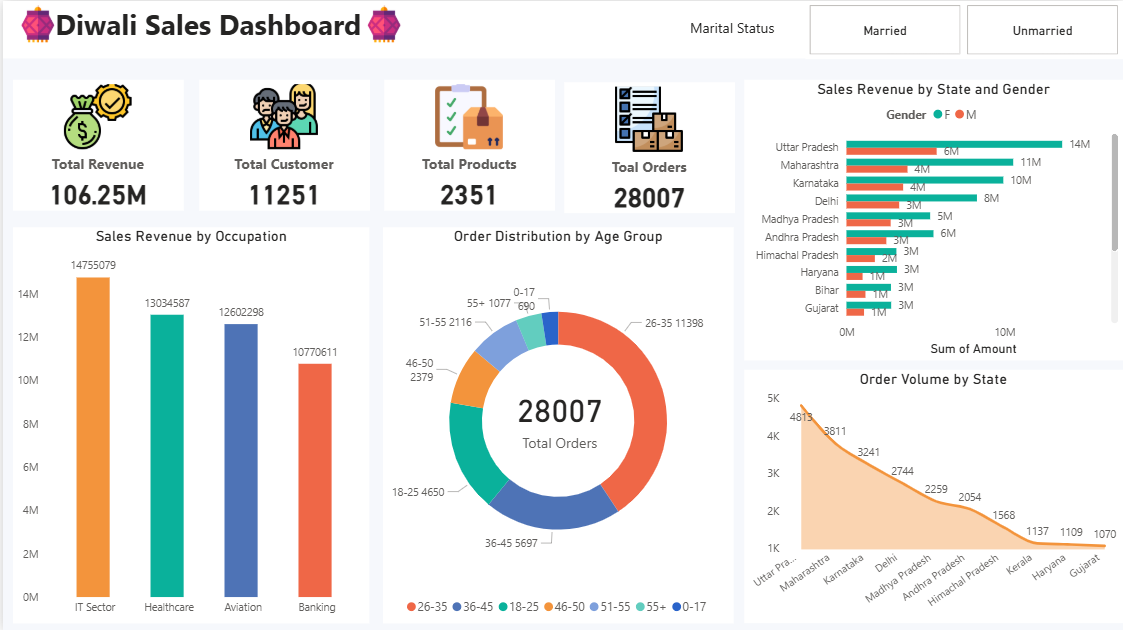
The Retail Festival Sales Power BI Dashboard Template helps analyze Diwali sales performance, customer behavior, and regional trends during the festive season. This Retail Festival Sales Power BI Dashboard Template includes key metrics such as total revenue, total orders, customer count, and product performance to evaluate sales effectiveness. It also highlights sales distribution by state, gender, occupation, and age group for deeper customer insights. Designed for retail managers, marketing teams, and business analysts, this Retail Festival Sales Power BI Dashboard Template helps identify high-performing regions, understand customer segments, and improve campaign strategies. It solves challenges related to tracking seasonal sales trends and analyzing customer purchasing patterns. The dashboard includes visuals such as state-wise sales charts, demographic analysis graphs, order trend visuals, and KPI cards for quick insights. Interactive filters allow users to explore data by marital status, region, and customer segments for detailed analysis. Download this Retail Festival Sales Power BI Dashboard Template and start analysing festive sales performance and customer trends today.
Interactive Demo Available
Explore this dashboard live in Power BI
Category
Templates
Chart Types
Bar, Area, Donut
Industry Types
Retail, Marketing
Main Colors
#F6F8FC
Mode
light
Version
Pro
PBIX File
🔑 Sign in to DownloadBuy this Dashboard