Published
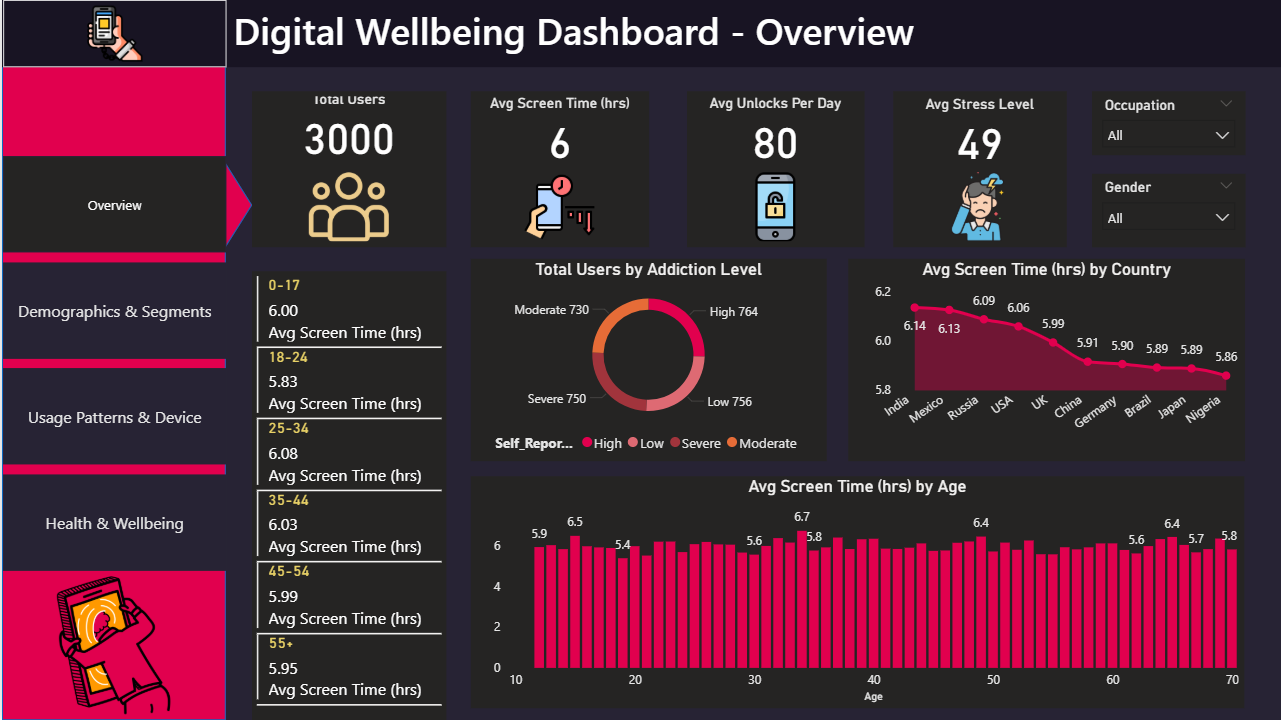
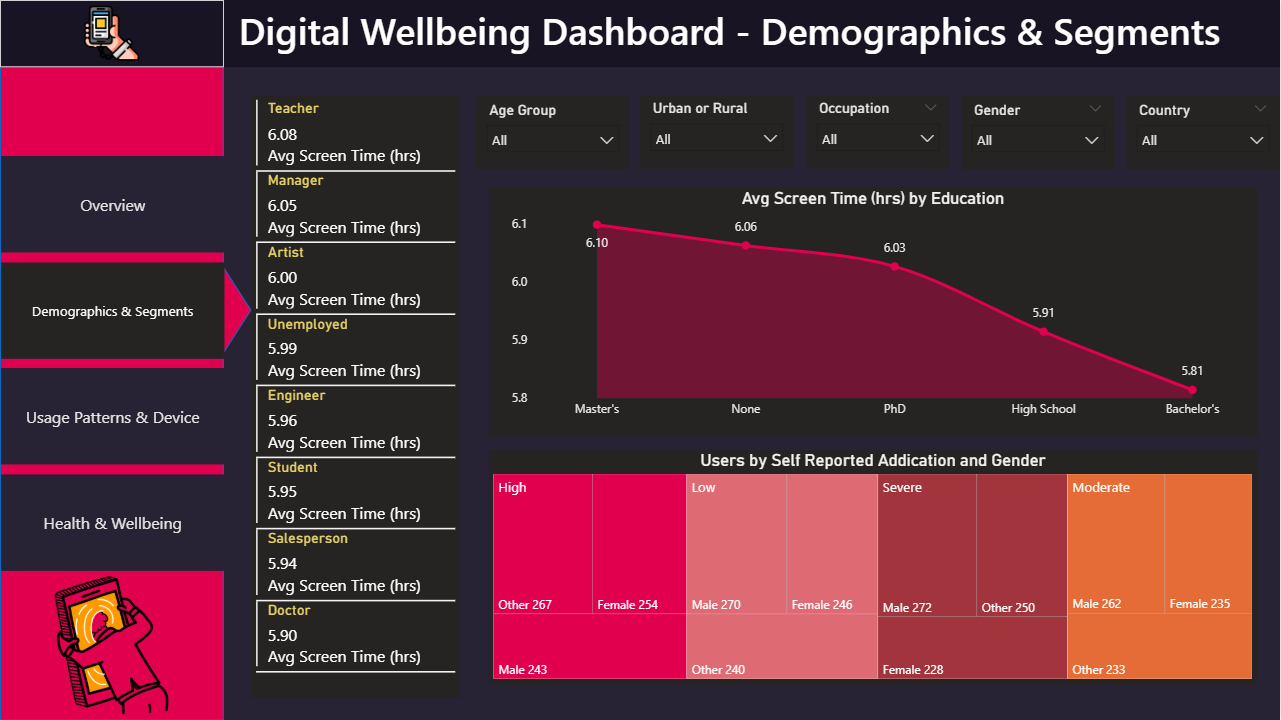
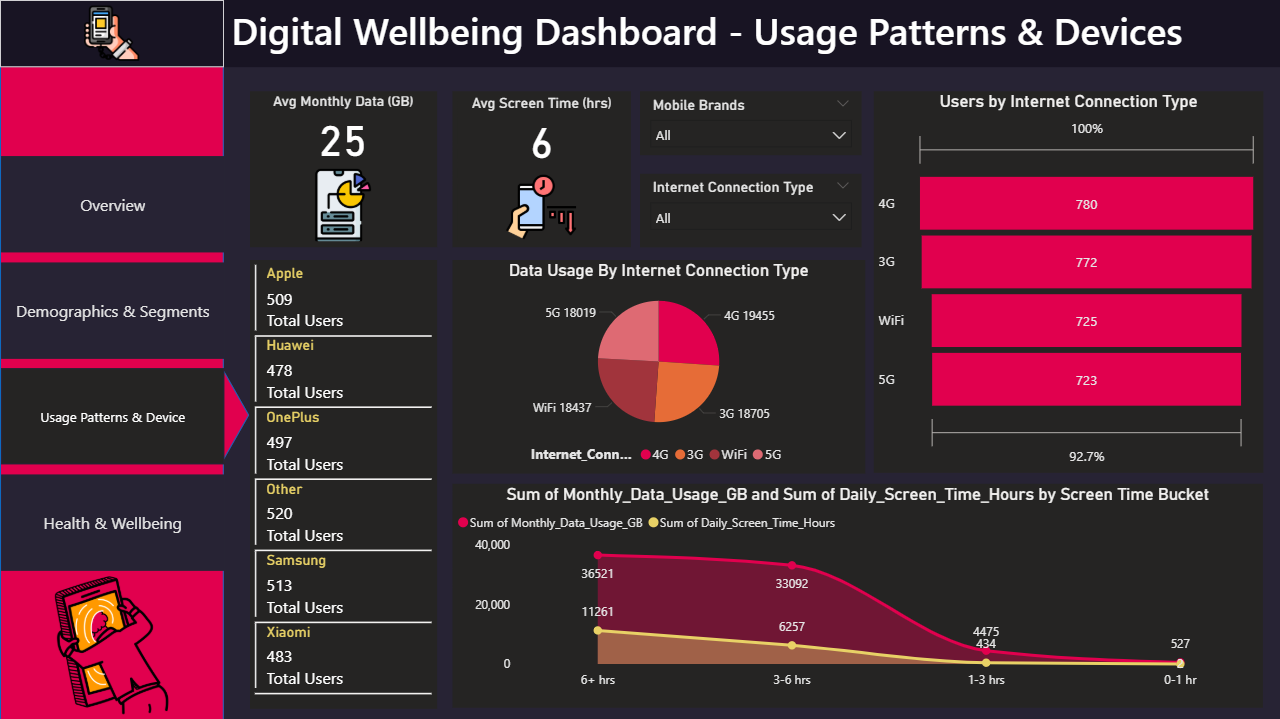
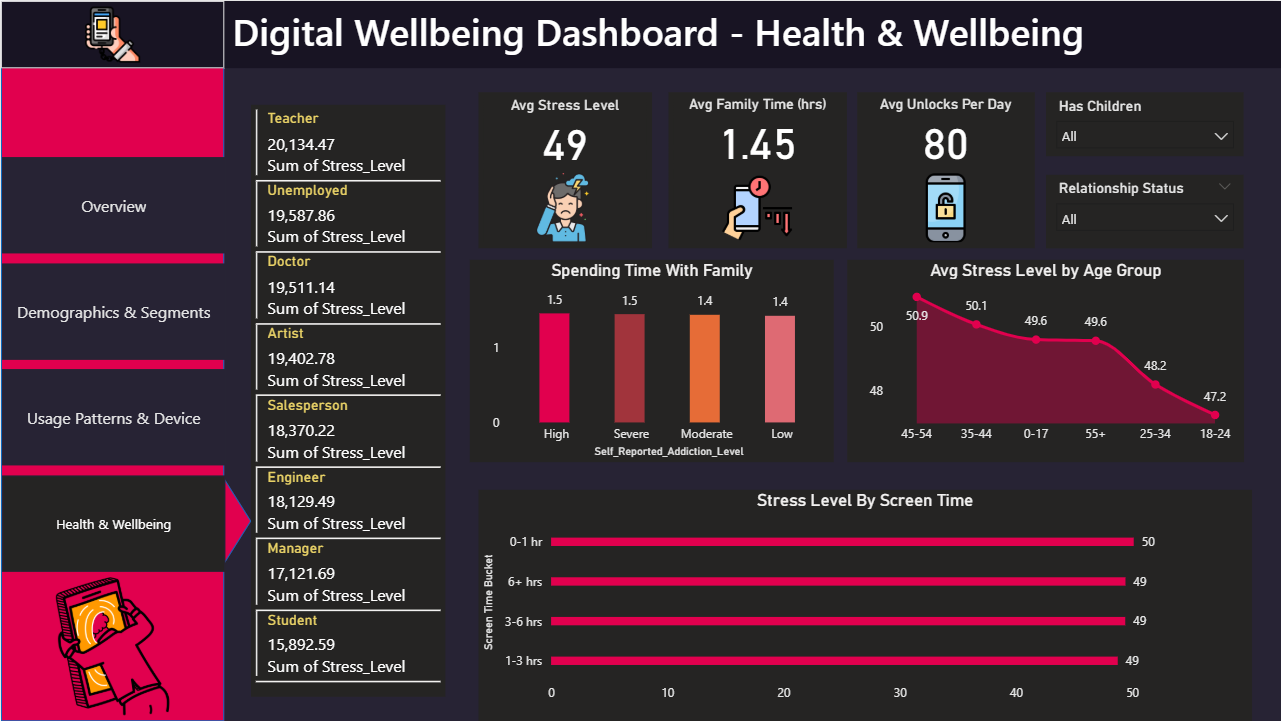
The Digital Wellbeing Power BI Dashboard Template helps analyze screen time, stress levels, and digital usage behavior across different demographics. This Digital Wellbeing Power BI Dashboard Template includes key metrics such as average screen time, stress level, family time, and daily phone unlocks to evaluate digital habits effectively. It also highlights comparisons across age groups, professions, education levels, and screen-time categories. Designed for researchers, HR teams, and wellness analysts, this Digital Wellbeing Power BI Dashboard Template helps identify digital addiction patterns, understand behavioral trends, and support well-being initiatives. It solves challenges related to tracking digital habits and analyzing their impact on stress and lifestyle. The dashboard includes visuals such as bar charts for comparisons, line charts for trend analysis, area charts for cumulative usage, donut charts for proportional distribution, and treemaps for hierarchical insights. Interactive filters allow users to explore data across demographics for deeper analysis. Download this Digital Wellbeing Power BI Dashboard Template and start analysing screen time and well-being trends today.
Interactive Demo Available
Explore this dashboard live in Power BI
Category
Templates
Chart Types
Bar, Line, Pie, Gauge, Area, Tree Map / Hierarchical Chart, Donut
Industry Types
Healthcare
Main Colors
Red
Mode
dark
Version
Pro
PBIX File
🔑 Sign in to DownloadBuy this Dashboard