Published
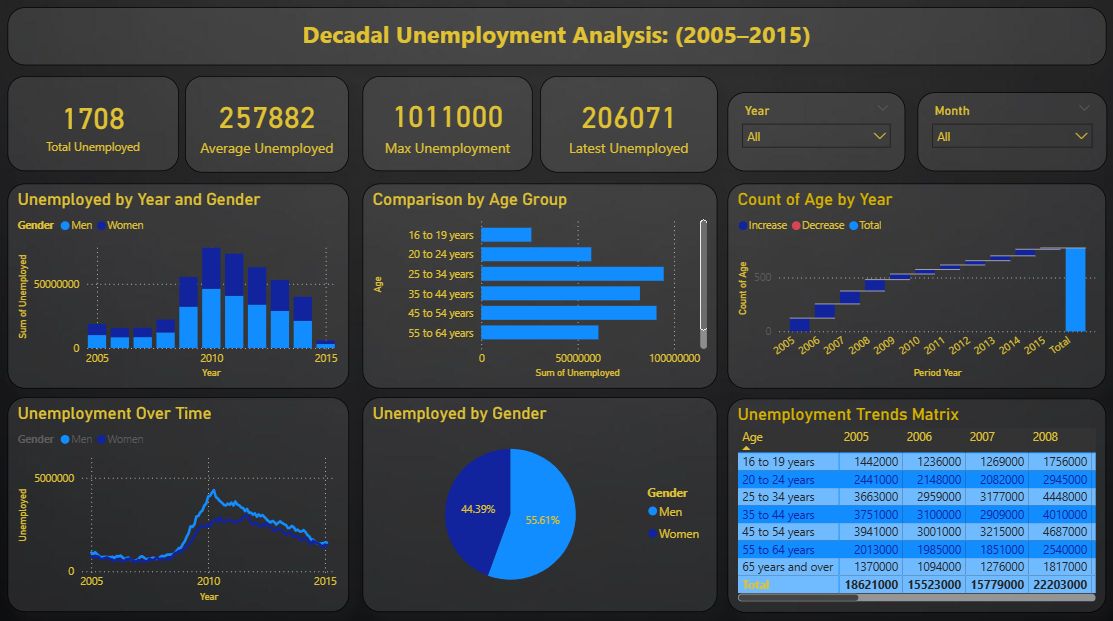
Analyse workforce trends with this Unemployment Analysis Power BI dashboard template designed to track unemployment patterns over time. This Unemployment Analysis Power BI dashboard template highlights key metrics such as total unemployed population, average unemployment levels, maximum unemployment figures, and latest reported values. It also tracks unemployment distribution by gender, age groups, and yearly trends to provide deeper labour market insights. This Unemployment Analysis Power BI dashboard template is ideal for economists, researchers, government agencies, and analysts who need to monitor employment trends and evaluate workforce conditions. It helps identify demographic disparities, understand long-term patterns, and support data-driven policy decisions. The dashboard includes stacked column charts for gender-wise analysis, line charts for trend visualization, bar charts for age group comparisons, waterfall charts for yearly changes, and pie charts for gender distribution. Interactive slicers for year and month enable flexible exploration of data. Download this Unemployment Analysis Power BI dashboard template and start tracking workforce trends and unemployment insights effectively.
Interactive Demo Available
Explore this dashboard live in Power BI
Category
Templates
Chart Types
Bar, Line, Pie
Industry Types
Economic Analysis
Main Colors
Blue, Yellow
Mode
dark
Version
Pro
PBIX File
🔑 Sign in to DownloadBuy this Dashboard