Published
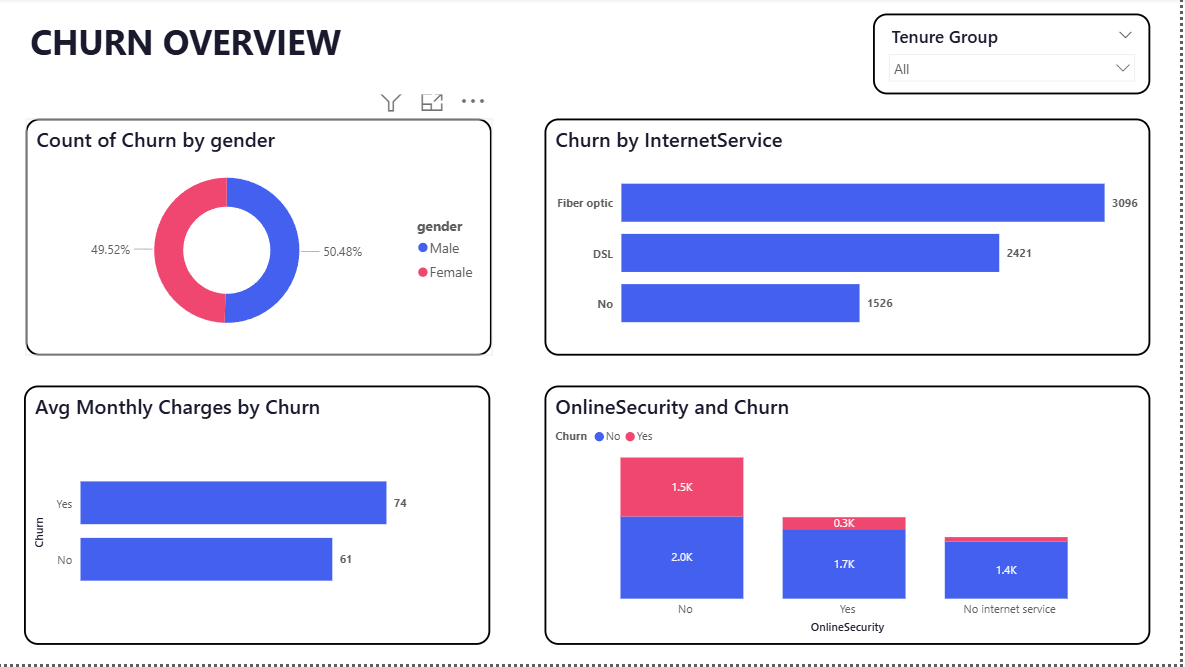
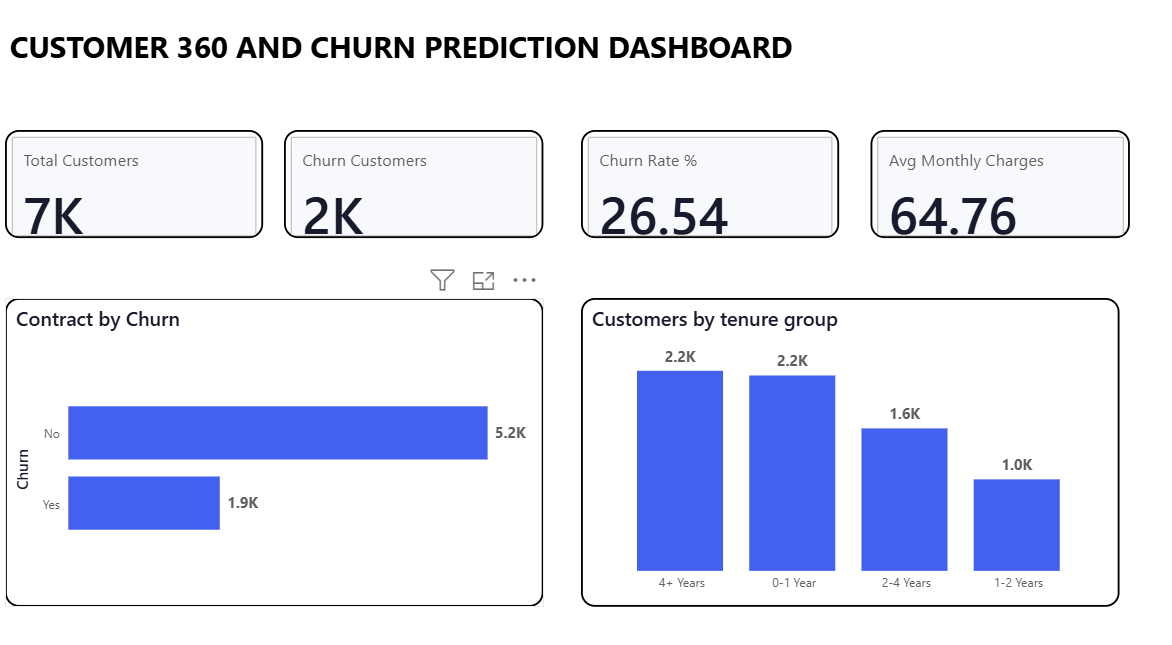
Summary The Briqlab Customer Churn & Retention Analytics Dashboard is a professional-grade Power BI solution designed to turn complex subscriber data into actionable retention intelligence. This dashboard provides a 360-degree view of customer behavior, combining demographic, billing, and usage data to help businesses identify churn drivers and safeguard recurring revenue with data-driven precision. Key Retention Performance Metrics Customer Health KPIs: Instant snapshots of total subscribers, churn rate, and average monthly charges for a real-time assessment of business stability. Contract & Tenure Analysis: Visual breakdown of churn patterns across contract types (month-to-month vs. long-term) and tenure groups to identify high-risk periods. Service Usage Correlation: Data-driven insights into how features like tech support, online security, and internet service types impact customer loyalty. Behavioral Segment Profiling: Analysis of payment methods and billing patterns to pinpoint friction points in the customer journey. Risk Segment Identification: Precision tracking of high-risk customer groups, enabling proactive intervention and personalized retention campaigns. Revenue Loss Mitigation: Interactive tools to uncover the root causes of churn, helping organizations optimize customer satisfaction and protect their bottom line. Make it Yours Download this Briqlab template to access the underlying DAX formulas and data architecture. Simply plug in your own CRM data or billing exports to start optimizing your customer retention strategy today.
Interactive Demo Available
Explore this dashboard live in Power BI
Category
Templates
Chart Types
Bar, Pie
Industry Types
Finance
Main Colors
Blue, Red
Mode
light
Version
Pro
PBIX File
🔑 Sign in to DownloadBuy this Dashboard