Published
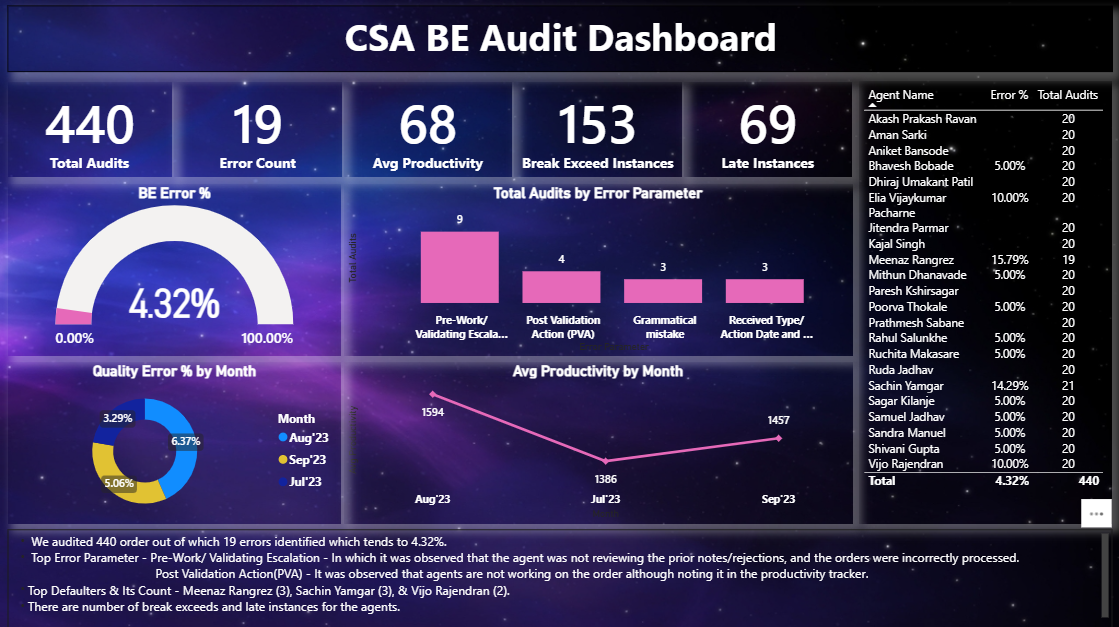
The CSA BE Audit Dashboard provides a consolidated view of audit quality, productivity, and compliance performance across CSA back-end operations. It highlights key KPIs such as total audits, error count, BE error percentage, average productivity, break exceed instances, and late instances. The dashboard further analyzes error distribution by parameter, monthly quality error trends, and average productivity by month, while offering agent-level audit performance with error percentages and audit volumes. This enables quality leaders to identify recurring issues, monitor agent compliance, and improve operational efficiency through data-driven insights.
Interactive Demo Available
Explore this dashboard live in Power BI
Category
Templates
Chart Types
Bar, Line, Gauge, Donut
Industry Types
Healthcare
Main Colors
Blue, #FFFFFF
Mode
dark
Version
Pro
PBIX File
🔑 Sign in to DownloadBuy this Dashboard