Published
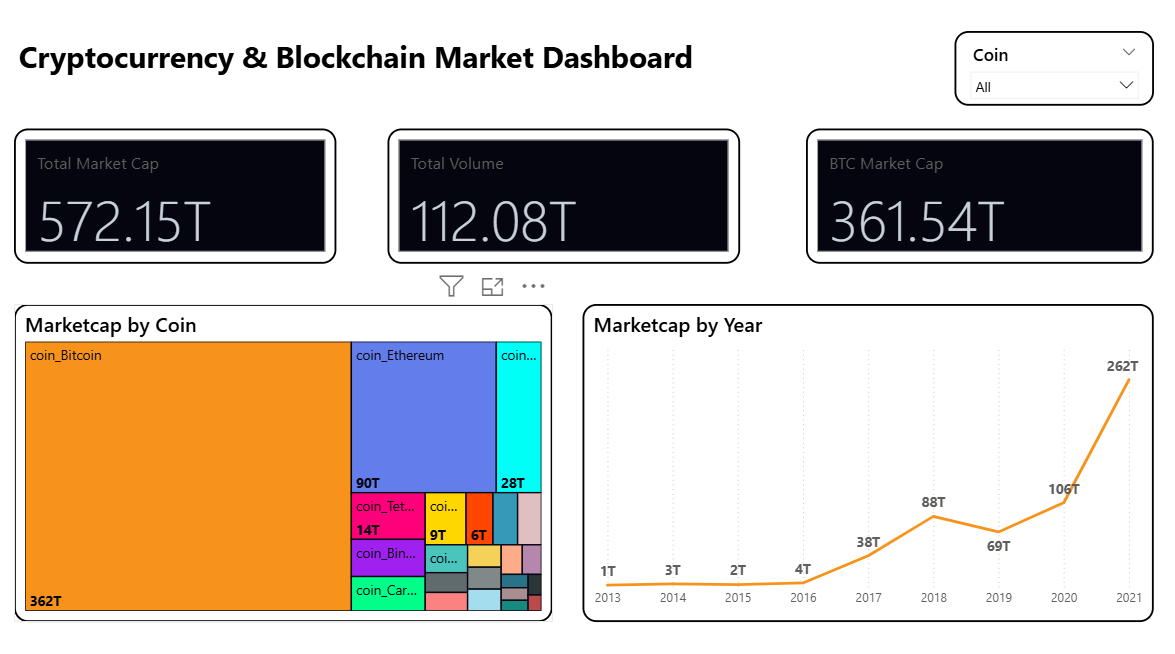
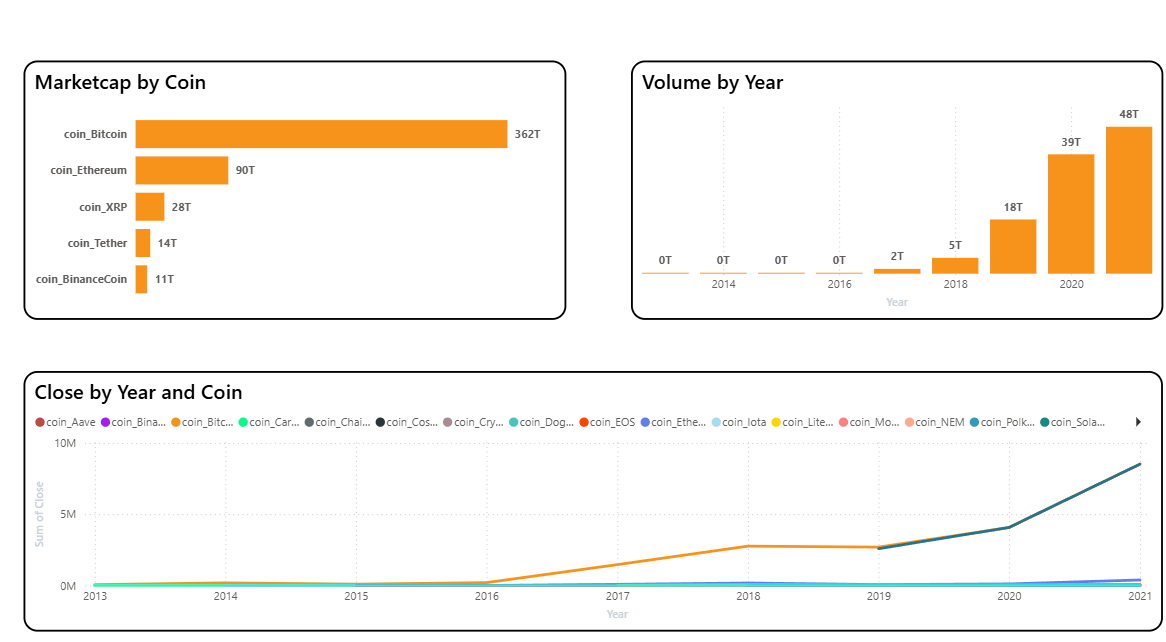
Summary: The Briqlab Cryptocurrency & Blockchain Market Dashboard is an advanced analytical tool designed to provide a 360-degree view of the digital asset ecosystem. By integrating real-time financial indicators with historical market trends, this dashboard transforms volatile crypto data into clear, actionable market intelligence. Key Market Performance Metrics: Global Market KPIs: Instant visibility into total market capitalization, trading volume, and Bitcoin dominance to gauge overall market health. Asset Distribution: A detailed breakdown of market cap across Bitcoin, Ethereum, and Altcoins to visualize value concentration and market structure. Historical Growth Trends: Time-series analysis of market cap and volume by year, highlighting long-term adoption patterns and institutional growth. Comparative Price Dynamics: Year-over-year performance tracking by coin to identify high-growth assets versus stable market performers. Volatility & Risk Assessment: Data-driven insights into price fluctuations and trading activity to support informed investment decisions. Make it Yours: Download this Briqlab template to access the underlying DAX formulas and data architecture. Simply plug in your own crypto API data or CSV exports to start optimizing your digital asset strategy today.
Interactive Demo Available
Explore this dashboard live in Power BI
Category
Templates
Chart Types
Bar, Line, Tree Map / Hierarchical Chart
Industry Types
Finance
Main Colors
#FFA500
Mode
light
Version
Pro
PBIX File
🔑 Sign in to DownloadBuy this Dashboard