Published
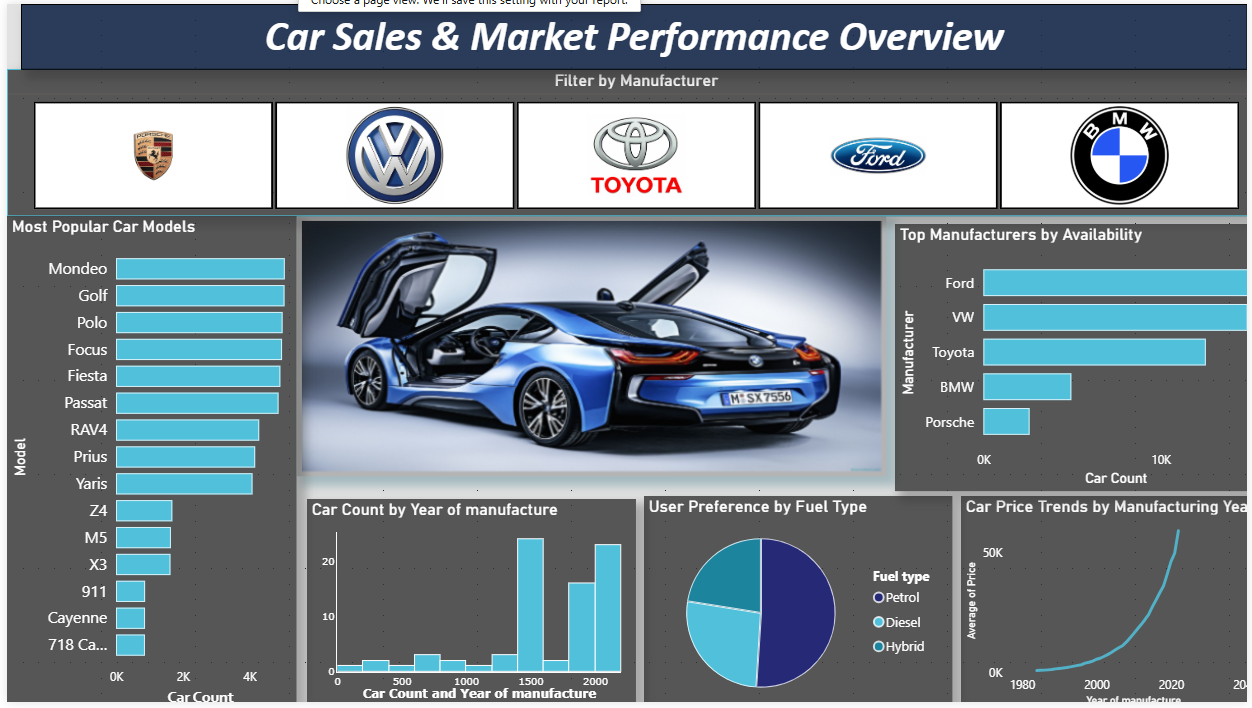
Analyse vehicle sales and market trends with this Automotive Sales Power BI dashboard template designed for performance and pricing insights. This Automotive Sales Power BI dashboard template highlights key metrics such as car availability, model popularity, manufacturer performance, and pricing trends over time. It also provides insights into fuel type preferences, production distribution by year, and shifts in market demand across brands. This Automotive Sales Power BI dashboard template is ideal for automotive analysts, dealership managers, and business strategists who need to monitor market dynamics and customer preferences. It helps identify top-performing models, compare manufacturers, and support data-driven decisions for inventory planning and sales strategies. The dashboard includes trend line charts for price analysis, bar charts for manufacturer comparison, distribution visuals for car models and production years, and filters for brand-level exploration. Interactive slicers allow users to focus on specific manufacturers and analyse performance in detail. Download this Automotive Sales Power BI dashboard template and start tracking car sales trends and market performance effectively.
Interactive Demo Available
Explore this dashboard live in Power BI
Category
Templates
Chart Types
Bar, Line, Pie, Area, Histogram, Scatter Plot
Industry Types
Marketing, Automotive
Main Colors
#565656
Mode
light
Version
Pro
PBIX File
🔑 Sign in to DownloadBuy this Dashboard