Published
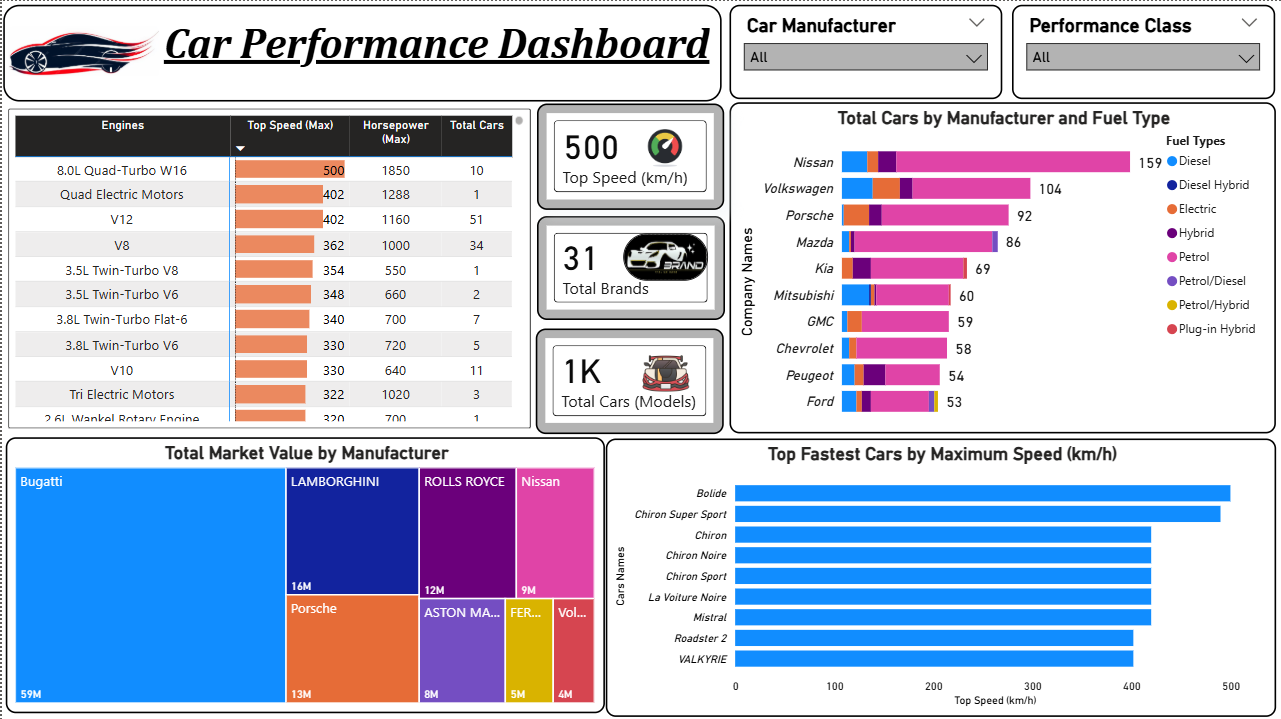
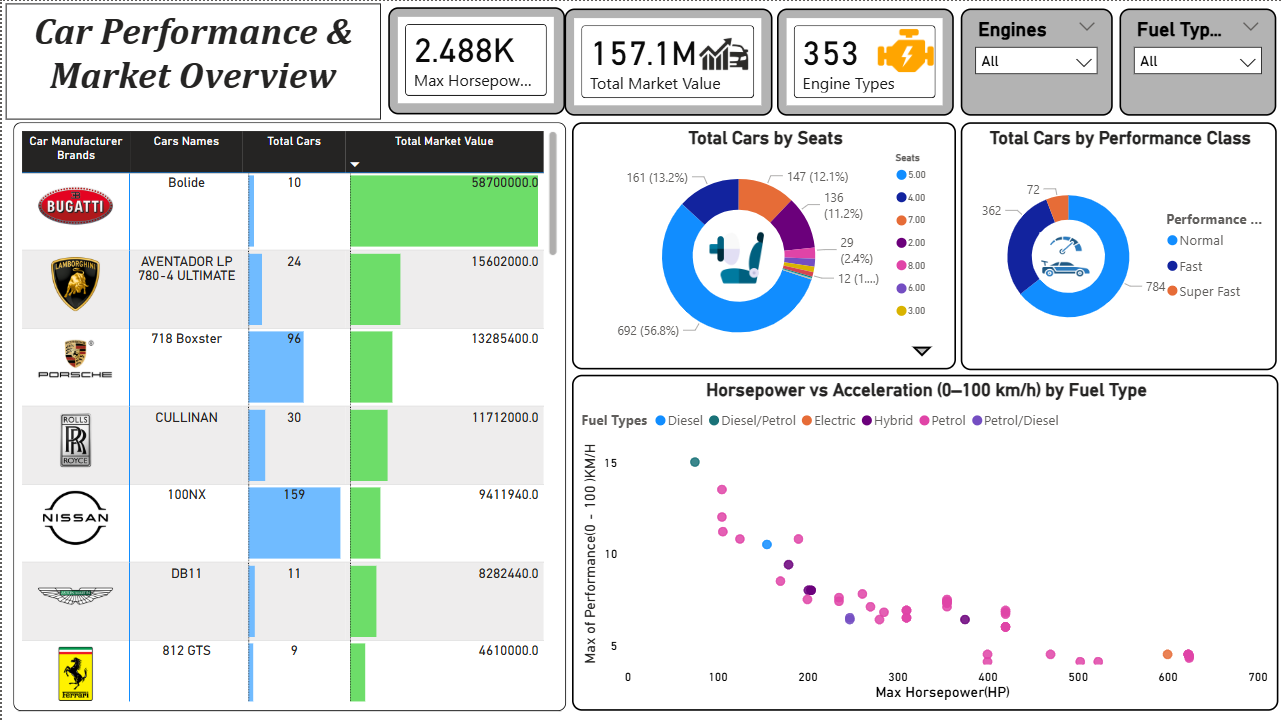
Analyse vehicle performance and market value with this Automotive Performance Power BI dashboard template designed for engine and benchmarking insights. This Automotive Performance Power BI dashboard template highlights key metrics such as maximum horsepower, top speed, total market value, number of engine types, total brands, and total car models. It also provides insights into performance classes, fuel type distribution, and seating capacity across manufacturers. This Automotive Performance Power BI dashboard template is ideal for automotive analysts, product strategists, and industry researchers who need to compare performance metrics and evaluate market positioning. It helps identify high-performance vehicles, understand engine efficiency trends, and support data-driven decisions in automotive planning. The dashboard includes scatter plots for horsepower vs acceleration analysis, bar charts for market value by manufacturer, distribution visuals for fuel type and seating capacity, and ranking charts for top speed comparisons. Interactive filters allow detailed exploration across brands and performance categories. Download this Automotive Performance Power BI dashboard template and start analysing vehicle performance and market trends effectively.
Interactive Demo Available
Explore this dashboard live in Power BI
Category
Templates
Chart Types
Bar, Scatter Plot, Tree Map / Hierarchical Chart, Donut
Industry Types
Automotive
Main Colors
Blue, Green, #FFFFFF
Mode
light
Version
Pro
PBIX File
🔑 Sign in to DownloadBuy this Dashboard