Published
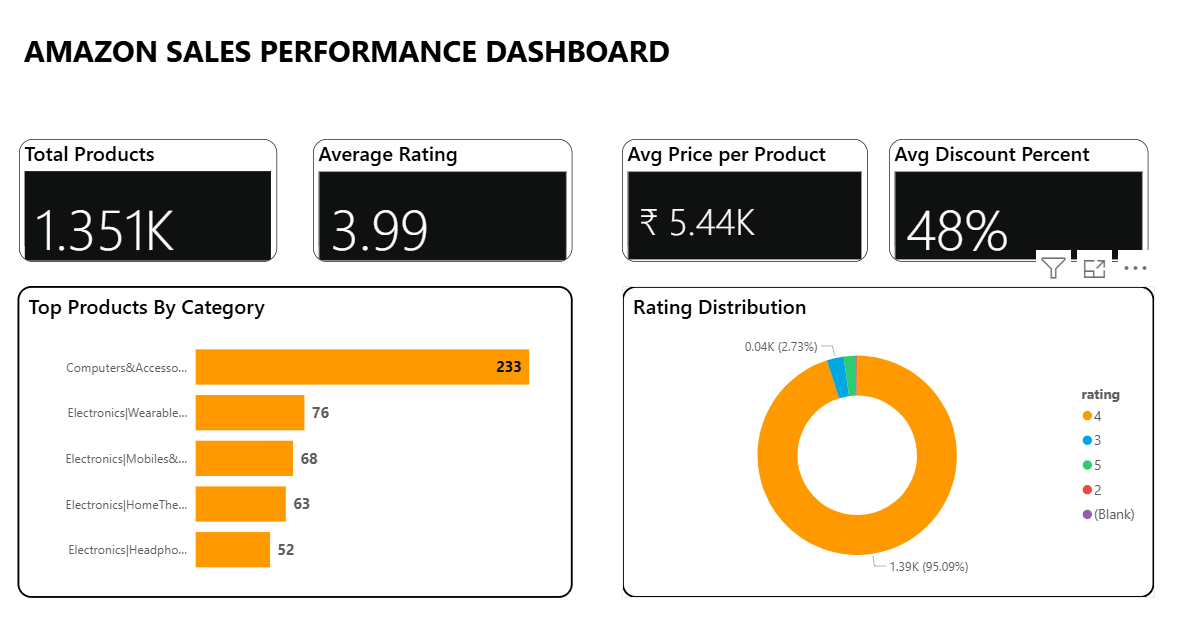
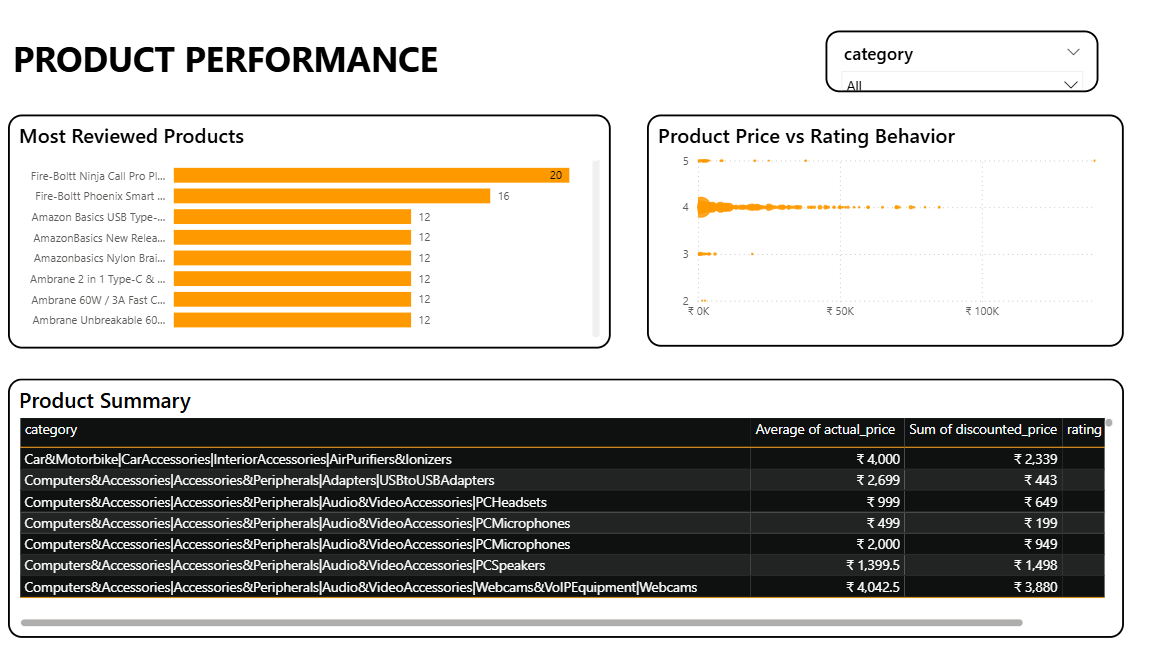
Summary The Briqlab Amazon Sales Performance Dashboard is a professional-grade Power BI solution designed to turn complex marketplace data into actionable e-commerce intelligence. This dashboard provides a comprehensive view of revenue performance, product trends, and customer engagement, empowering sellers to optimize their Amazon strategy and maximize profitability with confidence. Key Sales & Growth Metrics Core Revenue KPIs: Instant snapshots of total sales, units sold, and average discount percentage for an immediate health check of your storefront. Category & Product Performance: Detailed breakdown of revenue distribution to identify top-performing ASINs and high-growth product categories. Pricing & Rating Correlation: Visual analysis of how pricing strategies and discount levels impact customer ratings and overall sales velocity. Engagement & Social Proof: Precision tracking of review counts and product ratings to evaluate customer satisfaction and brand authority. Regional Growth Insights: Drill-down capabilities by geography and segment to uncover untapped market opportunities and localized trends. Profitability Optimization: Data-driven insights into the relationship between pricing behavior and revenue contribution for smarter marketing spend. Make it Yours Download this Briqlab template to access the underlying DAX formulas and data architecture. Simply plug in your own Amazon Seller Central reports or API data to start optimizing your e-commerce investment strategy today.
Interactive Demo Available
Explore this dashboard live in Power BI
Category
Templates
Chart Types
Bar, Pie
Industry Types
Retail, Marketing
Main Colors
#FFA500
Mode
light
Version
Pro
PBIX File
🔑 Sign in to DownloadBuy this Dashboard