Published
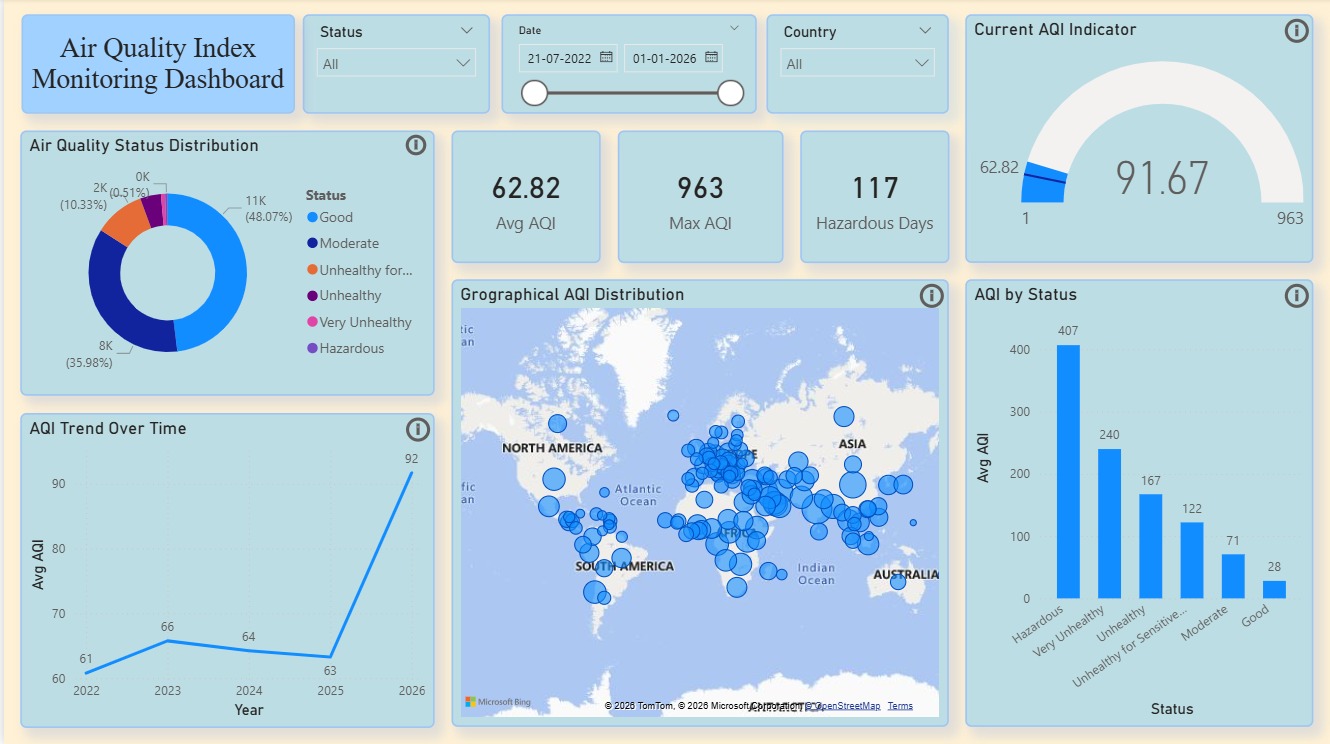
The Air Quality Power BI Dashboard Template helps track and analyze air pollution levels across regions using key Air Quality Index metrics. This Air Quality Power BI Dashboard Template includes important KPIs such as average AQI, maximum AQI, hazardous days, and current AQI status to provide a clear view of environmental conditions. It also highlights AQI distribution, regional comparisons, and trend patterns to understand pollution levels over time. Designed for environmental analysts, public health officials, and researchers, this Air Quality Power BI Dashboard Template helps identify high-risk zones, monitor pollution trends, and support sustainability planning. It solves challenges related to fragmented environmental data and lack of real-time insights into air quality conditions. The dashboard includes visuals such as AQI status distribution charts, geographical AQI maps, trend line analysis, and KPI cards for quick monitoring. Interactive filters allow users to explore data by date, country, and AQI status for deeper insights. Download this Air Quality Power BI Dashboard Template and start monitoring pollution trends and environmental performance today.
Interactive Demo Available
Explore this dashboard live in Power BI
Category
Templates
Chart Types
Line, Map, Gauge, Donut
Industry Types
Healthcare, Energy
Main Colors
Blue
Mode
light
Version
Pro
PBIX File
🔑 Sign in to DownloadBuy this Dashboard