Published
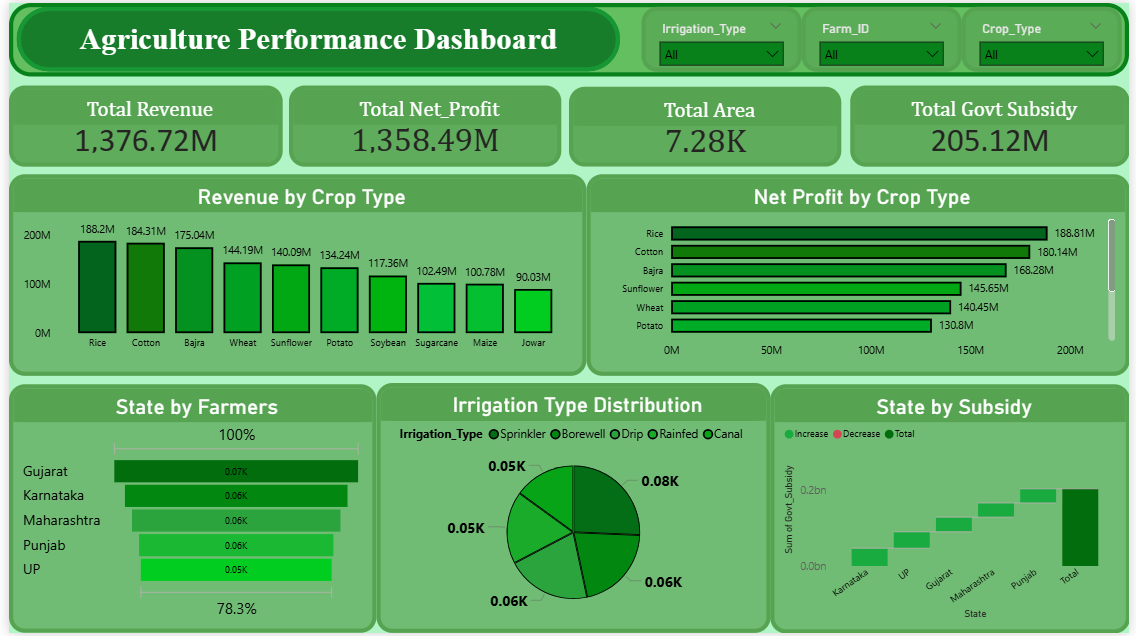
This dashboard provides a comprehensive overview of agricultural performance, highlighting key metrics such as total revenue, net profit, cultivated area, and government subsidy. It enables analysis of crop-wise revenue and profitability, along with insights into irrigation distribution and farmer contribution by state. The inclusion of subsidy trends and regional comparisons supports effective resource allocation and strategic planning. Overall, it delivers actionable insights to enhance agricultural productivity and financial performance.
Category
Templates
Chart Types
Bar, Pie
Industry Types
Agriculture & Food
Main Colors
Green
Mode
dark
Version
Pro
PBIX File
🔑 Sign in to DownloadBuy this Dashboard