The Briqlab Power BI word cloud is a premium custom visual that turns raw text into a weighted keyword cloud where word size reflects frequency or a numeric weight measure. Built natively for Power BI, it makes themes in survey responses, reviews, and social posts instantly visible. Map a text column, add an optional weight, and the visual arranges words by importance with clean placement, automatic stop-word filtering, and full report interactivity, giving analysts a fast, attractive way to surface what matters most in unstructured text.
## Key Features
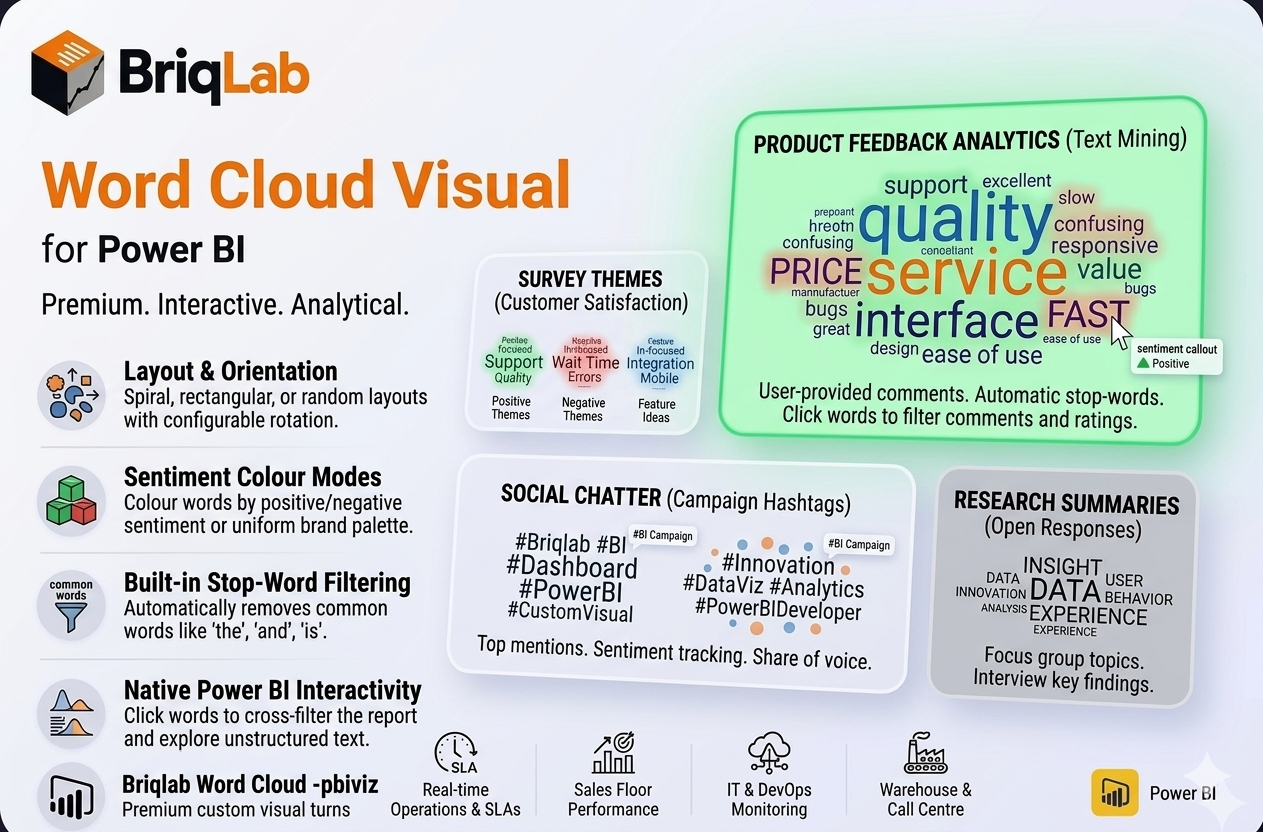
- Word size driven by frequency or a numeric weight measure
- Spiral, rectangular, or random placement layouts
- Colour modes for uniform brand colour, random palette, or sentiment (positive/negative)
- Built-in stop-word filtering removes common words such as the, and, is
- Custom stop-word list to exclude terms specific to your data
- Configurable rotation angle for varied word orientation
- Adjustable minimum and maximum font size and font family
- Click any word to cross-filter the rest of the report
- Unified Briqlab brand colour palette for consistent reporting
Top Use Cases
The Briqlab word cloud excels wherever text volume hides the signal and reading every row is impractical. Customer experience teams surface recurring themes in feedback and support tickets, while product managers mine review text to see which features customers mention most often. Marketing analysts visualise social media chatter and campaign hashtags, and research teams summarise hundreds of open-ended survey responses at a glance. With sentiment colouring, positive and negative language stand apart immediately, making the word cloud equally useful for brand monitoring, voice-of-customer programmes, employee engagement surveys, and qualitative text analysis across any industry.
Why Choose the Briqlab Word Cloud
The Briqlab word cloud combines genuine Power BI-native interactivity with text-analysis features rarely found together in one visual. Built-in stop-word filtering and a custom exclusion list keep clouds meaningful instead of cluttered with filler words. Sentiment colouring adds an analytical layer that plain frequency clouds lack, and three placement layouts let you match the look to your report. Every word participates in cross-filtering, so a single click reshapes the rest of the page, and the unified Briqlab palette keeps dashboards on brand without manual styling.