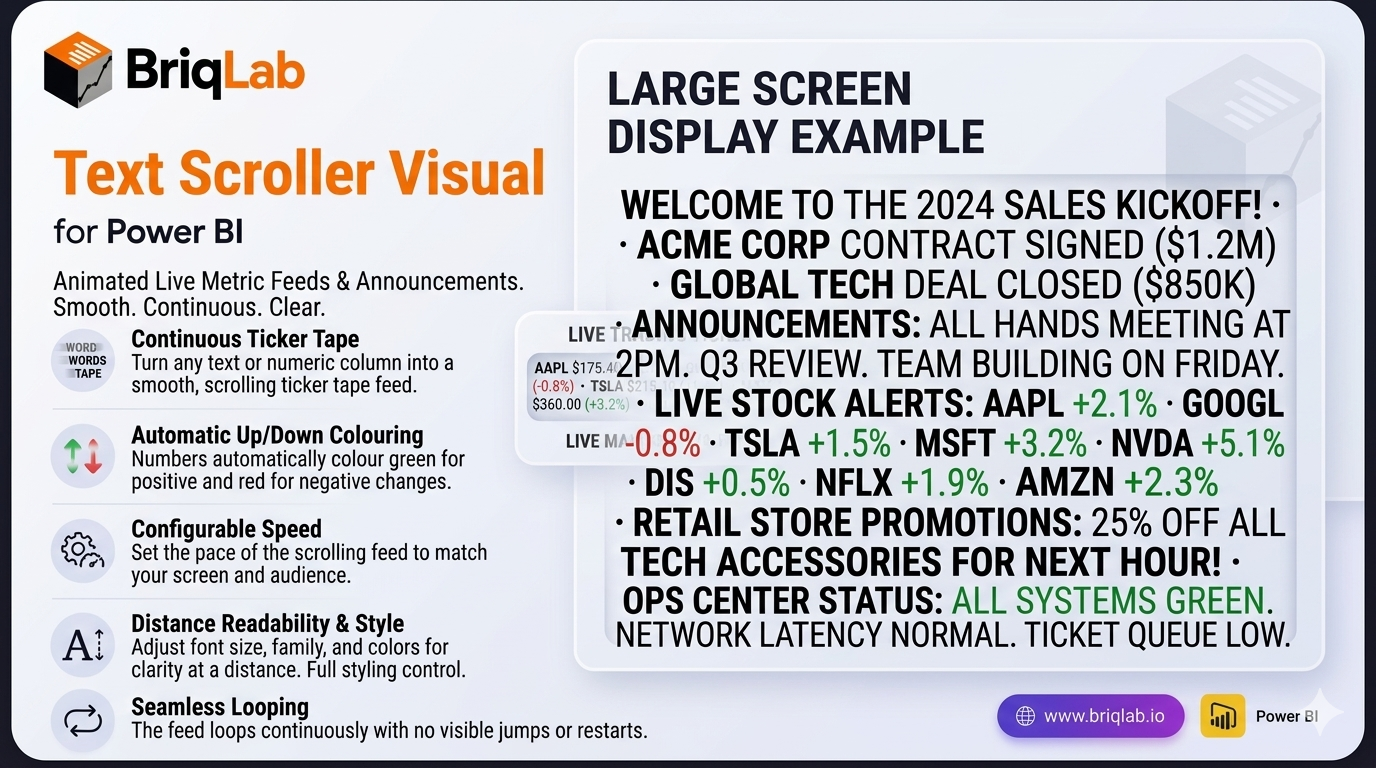
The Briqlab Power BI text scroller is an animated custom visual that turns any text or numeric column into a smooth, horizontally-scrolling ticker tape. Built natively for Power BI, it is ideal for live metric feeds, announcements, and digital signage on large screens. Connect a text or numeric measure and the values scroll continuously across the visual at your configured speed, looping seamlessly with no jumps. With automatic up/down colouring and full styling control, the text scroller brings a broadcast-quality news ticker to any dashboard.
Key Features
- Smooth, continuously scrolling ticker tape from any text or numeric column
- Seamless looping with no visible jumps or resets
- Automatic positive/negative colouring in green and red for up/down metrics
- Configurable scroll speed to set the pace of the feed
- Adjustable font size and font family for readability at distance
- Custom text colour and background colour to match your theme
- Configurable separator character between items
- Unified Briqlab brand colour palette for consistent reporting
Top Use Cases
The Briqlab text scroller is built for screens people watch rather than click. Retail floors run live sales totals and promotions; operations centres scroll throughput, uptime, and SLA status; trading desks push live price and movement feeds with automatic green/red colouring on rising and falling values. Event venues and reception areas display rolling announcements and welcome messages, while sales teams keep a motivating ticker of deals closed in view of the whole floor. Anywhere a dashboard is shown on a large screen and needs to communicate frequent updates at a glance, the scrolling ticker keeps key metrics and messages moving, readable, and impossible to miss.