Published by Rasiga
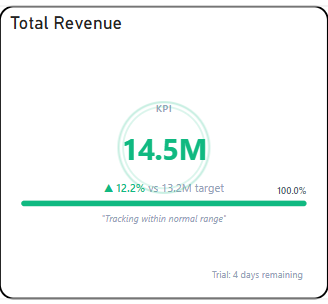
The Briqlab KPI Pulse is an interactive visualization used to display the real-time status and performance of key performance indicators in a compact and focused format. Each KPI card represents a distinct metric, with its value, trend, and status displayed together, making it easy to monitor critical business measures and their progress at a glance.
The visual supports dynamic status indicators, allowing users to instantly identify whether a KPI is performing above, below, or on target through colour-coded signals and directional trend arrows. This enables a more immediate understanding of overall business health and where attention is required across different performance areas.
It features automatic colour coding for clear status differentiation between positive, neutral, and negative performance states, and supports customizable labels and target values for improved contextual readability. The visual also includes pulse-style animations and trend sparklines, allowing users to observe recent movement patterns and momentum shifts across individual KPIs at a glance.
With its concise and dashboard-friendly design, the Briqlab KPI Pulse is effective for executive reporting, performance monitoring, and real-time tracking, making it an ideal tool for dashboards that require a quick and clear overview of multiple business metrics within a single unified display.