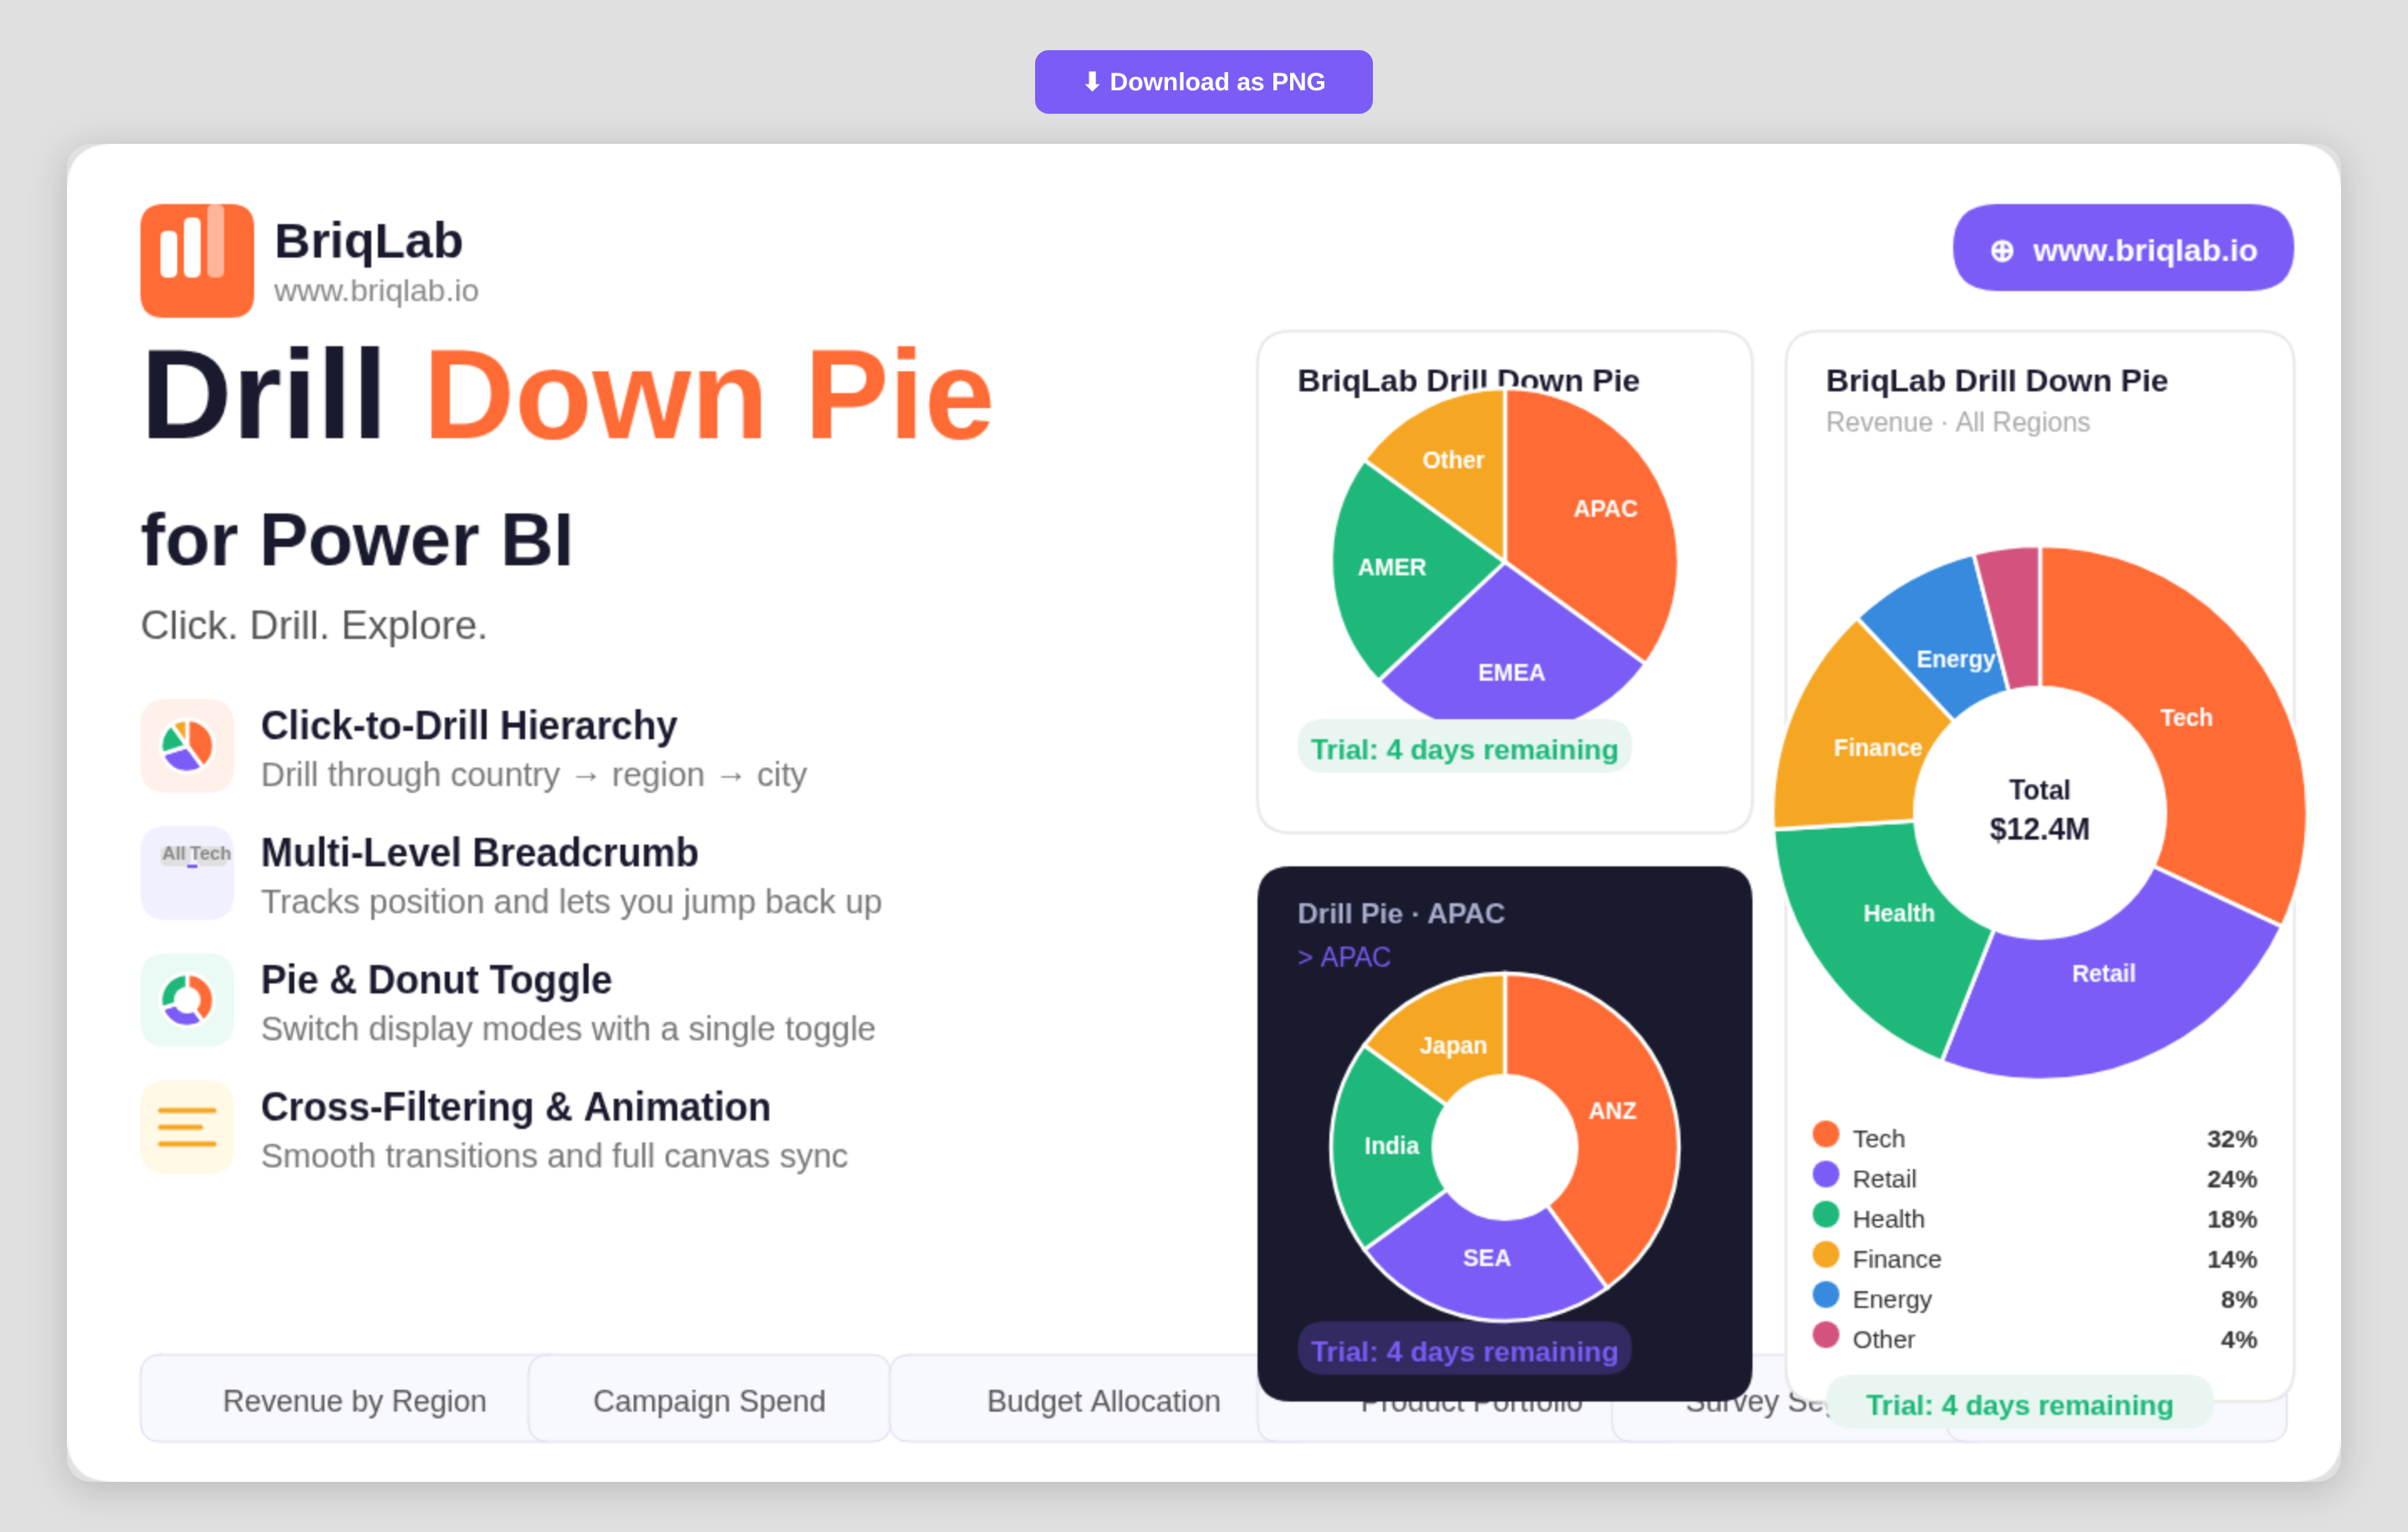
The Briqlab drill down pie chart for Power BI transforms a static slice view into an interactive exploration tool. Drag in a hierarchy of categories and click any segment to drill instantly into the next level, with a multi-level breadcrumb that always shows where you are. It is the part-to-whole visual your report has been missing when a single flat pie can no longer answer the question.
Key Features
- Click-to-drill navigation through a category hierarchy such as country, region, and city
- Multi-level breadcrumb that tracks your current position and lets you jump back up
- Single toggle to switch between pie and donut display modes
- Up to 10 fully configurable segment colours to match your report theme
- Data labels that show value, percentage, or category name
- Cross-filtering that keeps every other visual on the page in sync as you drill
- Right-click context menu with the full set of native Power BI actions
- Custom tooltips that support additional fields beyond the default value
- Smooth animated segment transitions on every drill and data refresh
Top Use Cases
Sales teams use the visual to move from total revenue down through region, territory, and individual rep without leaving the page. Marketing teams break campaign spend into channel and sub-channel. Finance teams explore budget allocation from division to cost centre, while operations teams drill from product family into individual SKUs. Any scenario that involves nested categories and part-to-whole comparison, including survey segmentation, portfolio breakdowns, and organisational headcount, becomes a guided click-through rather than a stack of separate charts. Because the drill state lives inside one tile, a single report page can replace several drill-through pages.
Why Choose the Briqlab Drill Down Pie
Built as a native Power BI custom visual, the Briqlab Drill Down Pie pairs polished design with genuine report interactivity. Drilling cross-filters the rest of your canvas automatically, so a single click reshapes every connected visual rather than just the pie itself. The breadcrumb and animated transitions keep deep hierarchies legible, and the pie-to-donut toggle plus 10 configurable colours let you match any brand. Right-click context menu support and custom tooltips mean it behaves exactly like a first-party visual, with formatting depth that the built-in pie cannot reach. Every formatting choice persists with the report, so the look you build is the look your audience sees.